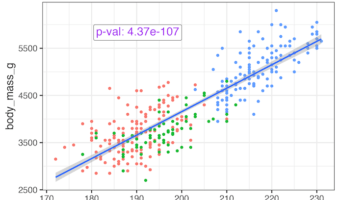
Adding statistical significance indicators to your data visualizations is crucial for communicating research findings effectively. When working with ggplot2 in R, displaying p-values directly on scatter plots helps viewers immediately understand the statistical relationship … [Read more...] about How to Annotate a plot with P-value in ggplot2
ggtext
How to Add matching colors to keywords in title text
This tutorial teaches you how to color words in a ggplot title to match the data in the plot itself. This approach has two main benefits: Improves interpretation: Readers can understand the chart more quickly. Reduces clutter: It can eliminate the need for a … [Read more...] about How to Add matching colors to keywords in title text
How to add color to axis tick labels: Hint – element_markdown() in ggtext

In this tutorial, we will learn about a nice ggplot2 trick/tip that enables colored text on axis tick labels. Thanks to new theme element element_markdown() in ggtext, R package developed by Claus Wilke, we can add colors to axis text labels. To get started, let us load the … [Read more...] about How to add color to axis tick labels: Hint – element_markdown() in ggtext