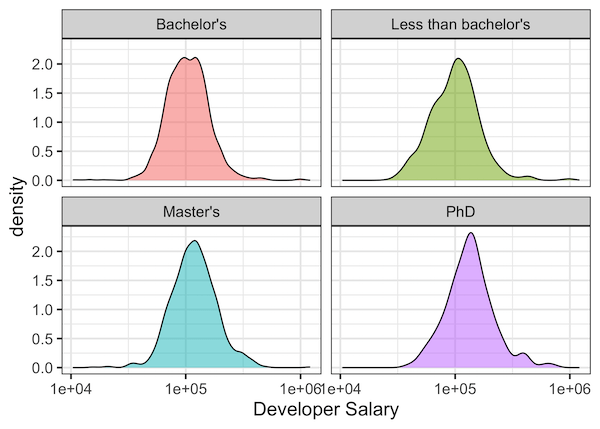
When you have data for a variable corresponding to multiple groups, visualizing the data for each group can be useful. One of the techniques to use is to visualize data from multiple groups in a single plot. However, a better way visualize data from multiple groups is to use “facet” or small multiples. ggplot2 makes… Continue reading How To Make Facet Plot using facet_wrap() in ggplot2?
