
In this tutorial, we’ll dive into grouped boxplots using ggplot2 in R and demonstrate how to reorder facet variables based on the mean difference between groups. Imagine comparing sales performance across multiple regions or test scores across different schools—by reordering … [Read more...] about How to order facet variable in grouped boxplot by mean difference between groups in ggplot2
Boxplot ggplot2
Violinplot vs Boxplot: Why Violinplot Is Better Than Boxplot
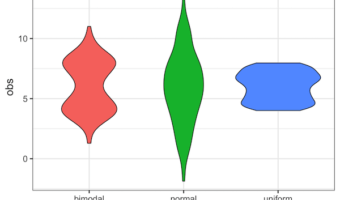
Violinplot or boxplot? What is better? Boxplots is great visualization to show a numerical variable. A boxplot shows "four main features about a variable: center, spread, asymmetry, and outliers". With the five summary statistics one can easily draw boxplot even by hand. Violin … [Read more...] about Violinplot vs Boxplot: Why Violinplot Is Better Than Boxplot
Reorder Boxplots in R (ggplot2): 4 Easy Examples

Why Reorder Boxplots in ggplot2? By default, ggplot2 arranges categorical variables alphabetically. Reordering boxplots by a numeric summary (mean or median) helps highlight patterns—like which airlines fly fastest on average. This makes your visualization more … [Read more...] about Reorder Boxplots in R (ggplot2): 4 Easy Examples
How To Color Boxplots By a Variable in R with ggplot2?

In this tutorial, we learn how to color boxplots in R by a variable. With ggplot2 in R, we can color boxplots in multiple ways. In this post, we will first see how to make a simple boxplot in R. And then we will learn how to fill the boxes on boxplot by a variable. Then we will … [Read more...] about How To Color Boxplots By a Variable in R with ggplot2?
Horizontal Boxplots with ggplot2 in R
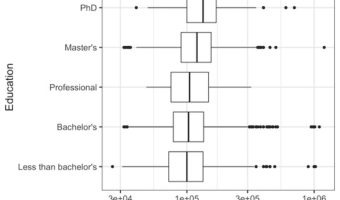
Horizontal boxplots are useful when you are making a boxplot multiple groups & you want the group names to be easily readable. And horizontal boxplots can also make it easy see the pattern among the groups quickly. In this post will learn how to make horizontal boxplots with … [Read more...] about Horizontal Boxplots with ggplot2 in R