• Skip to primary navigation
  • Skip to main content
  • Skip to primary sidebar

Data Viz with Python and R

Learn to Make Plots in Python and R

  • Home
  • Seaborn
  • Matplotlib
  • ggplot2
  • Altair
  • About
    • Privacy Policy
  • Visualizing Activation Functions in Neural Networks
  • Confusion Matrix Calculator
  • Visualizing Dropout Rate in Neural Network
  • Visualizing Loss Functions in Neural Networks
  • Show Search
Hide Search

barplot ggplot2

How to Reorder bars in barplot with ggplot2 in R

datavizpyr · December 23, 2019 ·

Descending order barplots in ggplot2

In this post, we will learn how to order bars in a barplot using ggplot2 in R. When we make barplot with ggplot2 on a character variable it places the group in alphabetical order. Here we will learn to use two functions, reorder() from base R and fct_reorder() function from … [Read more...] about How to Reorder bars in barplot with ggplot2 in R

Filed Under: barplot ggplot2, fct_reorder() barplot, R, reoprder barplot, reorder() barplot Tagged With: reorder barplot with fct_reorder, reorder barplots in R

How To Make Barplots with ggplot2 in R?

datavizpyr · December 21, 2019 ·

Simple Barplot with geom_col(): ggplot2

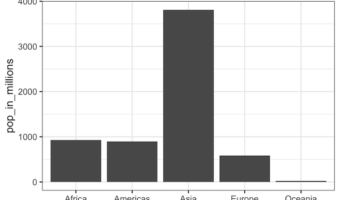
Barplots are a popular graphics that is widely used to show categorical data with retangular bars whose height represent the quantitative value the variable. In this post we will see multiple examples of making bar plots using ggplot2 in R. Let us first load tidyverse, a … [Read more...] about How To Make Barplots with ggplot2 in R?

Filed Under: barplot ggplot2, R Tagged With: ggplot2, R

  • « Go to Previous Page
  • Page 1
  • Page 2
  • Page 3

Primary Sidebar

Python & R Viz Hubs

  • Seaborn Guide & Cookbook
  • ggplot2 Guide & Cookbook
  • Matplotlib Guide & Cookbook
  • Confusion Matrix Calculator
  • Visualizing Activation Functions
  • Visualizing Dropout
  • Visualizing Loss Functions

Buy Me a Coffee

Copyright © 2026 · Daily Dish Pro on Genesis Framework · WordPress · Log in

Go to mobile version