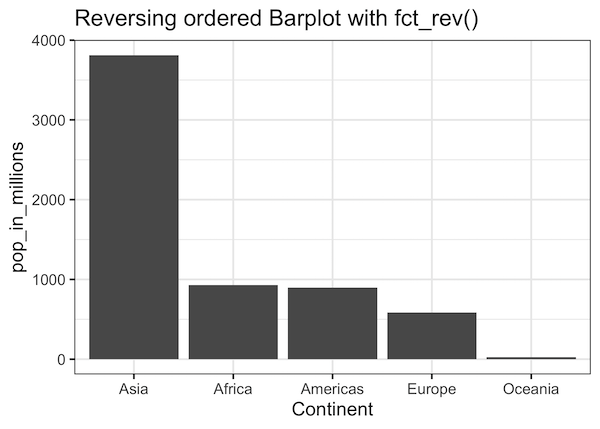
In this post, we will learn how to order bars in a barplot using ggplot2 in R. When we make barplot with ggplot2 on a character variable it places the group in alphabetical order. Here we will learn to use two functions, reorder() from base R and fct_reorder() function from forcats package to order the… Continue reading How to Reorder bars in barplot with ggplot2 in R
Category: barplot ggplot2
How To Make Barplots with ggplot2 in R?
Barplots are a popular graphics that is widely used to show categorical data with retangular bars whose height represent the quantitative value the variable. In this post we will see multiple examples of making bar plots using ggplot2 in R. Let us first load tidyverse, a suite of R packages including ggplot2. We will use… Continue reading How To Make Barplots with ggplot2 in R?
