

Creating a mean and SD plot with Seaborn Objects is essential for visualizing statistical summaries and data distribution across different groups in your dataset. The new Seaborn Objects interface (available from Seaborn 0.12.0+) follows grammar of graphics principles, allowing you to build sophisticated mean and standard deviation plots layer by layer. 👉 Want more? Explore… Continue reading Mean and SD plot with Seaborn objects
Category: Seaborn objects
Histogram Tutorial with Seaborn Grammar of Graphics API

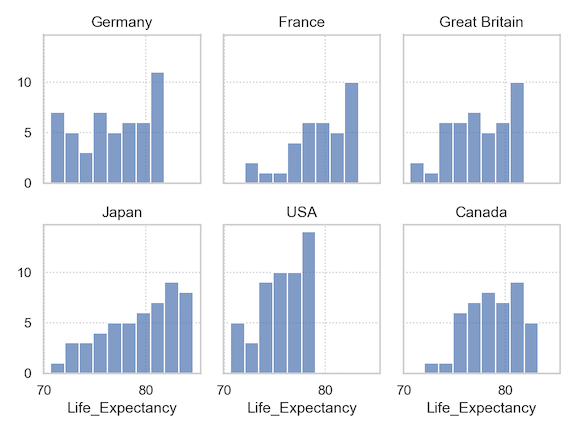
Seaborn, one of the Python data visualisation libraries had a huge update with Seaborn version 0.12.0 in September 2022. A really exciting development is new API for grammar of graphics like ggplot2. The introduction of seaborn.objects interface is the new API Taking inspiration from Wilkinson’s grammar of graphics — and its implementation in libraries such… Continue reading Histogram Tutorial with Seaborn Grammar of Graphics API