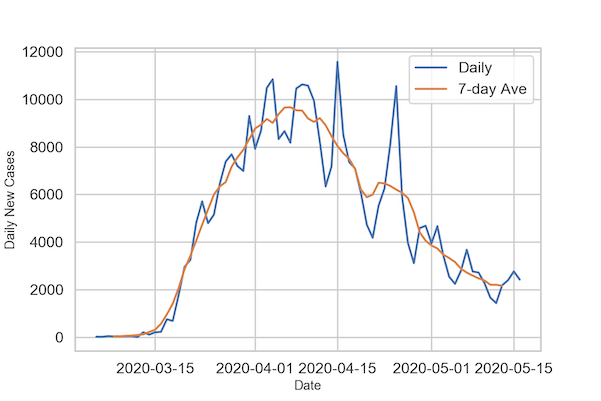
Time Series plots are a great way to see a trend over a period of time. However, if the numerical variable that we are plotting in time series plot fluctuates day to day, it is often better to add a layer moving average to the time series plot. In this post, we will see examples… Continue reading How to Make a Time Series Plot with Rolling Average in Python?
