
In this tutorial, we will learn how to add vertical or horizontal lines to "small multiples" i.e. multiple subplots of similar kind using Seaborn's refline() function (h/t to Chris Moffitt of @pbpython). Vertical/Horizontal lines are often useful to show where the mean or median … [Read more...] about How to Add Vertical/Horizontal Lines to Subplots with Seaborn
Seaborn
How To Add Mean/Median Line to a Seaborn Displot
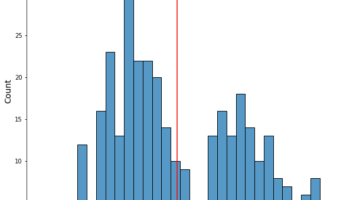
In this tutorial, we will learn how to add mean or median vertical line to a plot made with Seaborn's displot() function. Seaborn's displot() offers capability to visualize the univariate or bivariate distribution of data. Here we will make a histogram with Seaborn's displot() … [Read more...] about How To Add Mean/Median Line to a Seaborn Displot
How To Annotate Barplot with bar_label() in Matplotlib

Annotating barplots with labels like texts or numerical values can be helpful to make the plot look better. Till now, one of the options add annotations in Matplotlib is to use pyplot's annotate() function. Starting from Matplotlib version 3.4.2 and above, we have a new … [Read more...] about How To Annotate Barplot with bar_label() in Matplotlib
Visualizing Missing Data with Seaborn Heatmap and Displot

Understanding the level of missing data in the data set analysis should be one of the first things we all should do while doing data analysis. In this post, we will use Python's Seaborn library to quickly visualize how much data is missing in a data set. One of the ways to … [Read more...] about Visualizing Missing Data with Seaborn Heatmap and Displot
How to Combine Two Seaborn plots with Shared y-axis
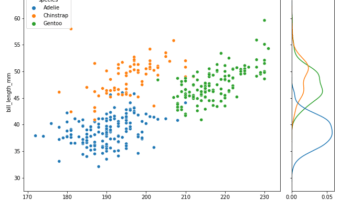
In this tutorial, we will see how to join or combine two plots with shared y-axis. As an example, we will make a scatterplot and join with with marginal density plot of the y-axis variable matching the variable colors. Thanks to Seaborn's creator Michael Waskom's wonderful tip on … [Read more...] about How to Combine Two Seaborn plots with Shared y-axis