
In this tutorial, you’ll learn how to create an annotated heatmap in Python using Seaborn, a powerful data visualization library built on Matplotlib. We’ll start by generating a basic heatmap with the heatmap() function to visualize data in a color-coded grid. Then, we’ll take it … [Read more...] about How to make Annotated heatmap with Seaborn in Python
Seaborn
How to Add Text Annotations to Data Points in Python
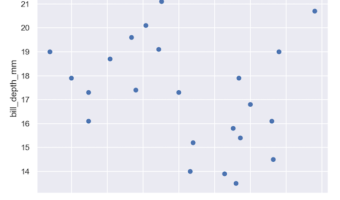
In this tutorial, we will learn how to add text annotations to all data points in a scatterplot made with Python. One of the easier ways to add text annotations to points in a scatter plot is to use Seaborn in Python. Seaborn Objects, a newer Seaborn API with grammar of graphics … [Read more...] about How to Add Text Annotations to Data Points in Python
How to increase the gap between boxes in a grouped boxplot with Seaborn
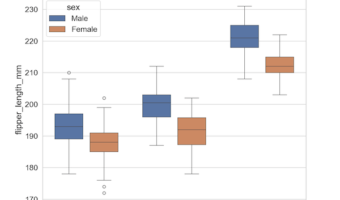
In this post we will learn how to increase the gap between boxes in a nested or grouped boxplot made with Seaborn in Python. We will use Seaborn v0.13.0 that came out in September 2023's feature to increase the gap size. Let us first load the modules/packages needed to make … [Read more...] about How to increase the gap between boxes in a grouped boxplot with Seaborn
Mean and SD plot with Seaborn objects
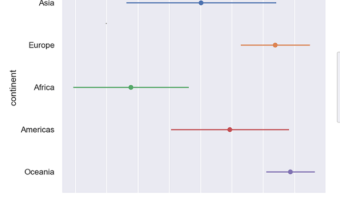
Creating a mean and SD plot with Seaborn Objects is essential for visualizing statistical summaries and data distribution across different groups in your dataset. The new Seaborn Objects interface (available from Seaborn 0.12.0+) follows grammar of graphics principles, allowing … [Read more...] about Mean and SD plot with Seaborn objects
Histogram Tutorial with Seaborn Grammar of Graphics API
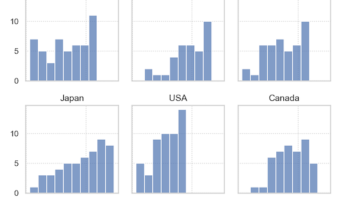
Seaborn, one of the Python data visualisation libraries had a huge update with Seaborn version 0.12.0 in September 2022. A really exciting development is new API for grammar of graphics like ggplot2. The introduction of seaborn.objects interface is the new API Taking … [Read more...] about Histogram Tutorial with Seaborn Grammar of Graphics API