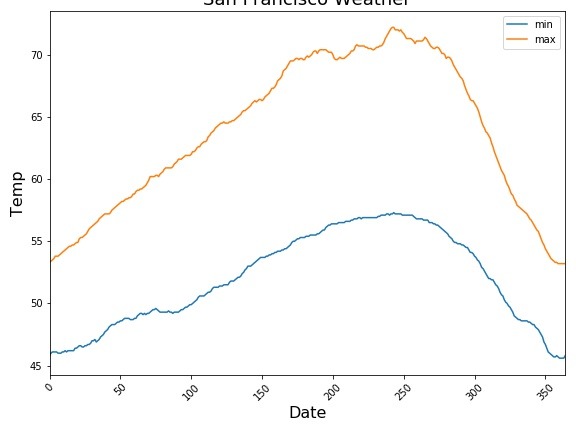
In this tutorial, we will learn how to make line plot or time series plot using Pandas in Python. Pandas’ plotting capabilities are great for quick exploratory data visualisation. Time Series plot is a line plot with date on y-axis. Let us load the packages needed to make line plots using Pandas. We will use… Continue reading Time Series Plot or Line plot with Pandas
