In this tutorial, we will learn how to make violin plots using Python’s Matplotlib library. Matplotlib has a function called violinplot() and we will use that function to examples of making violinplot first and then learn to customize the violinplots. Unlike other tutorials on violinplot with Matplotlib, here we start with data stored in a… Continue reading How to Make Violin plots with Matplotlib
Category: Python
How to View All Matplotlib Plot Styles and Change


In this tutorial, we will learn how to change the background theme or style of a plot made with matplotlib. Matplotlib offers a number of ready to use styles to use for matplotlib plots. We will first learn how to find the available style options and then learn to set a matplotlib style of interest… Continue reading How to View All Matplotlib Plot Styles and Change
How to Add Vertical/Horizontal Lines to Subplots with Seaborn

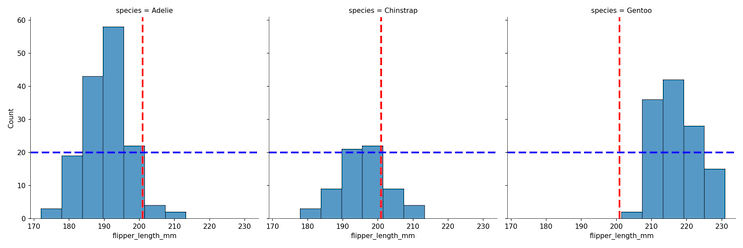
In this tutorial, we will learn how to add vertical or horizontal lines to “small multiples” i.e. multiple subplots of similar kind using Seaborn’s refline() function (h/t to Chris Moffitt of @pbpython). Vertical/Horizontal lines are often useful to show where the mean or median values of the variables of interest and in a simple plot… Continue reading How to Add Vertical/Horizontal Lines to Subplots with Seaborn
How To Add Mean/Median Line to a Seaborn Displot

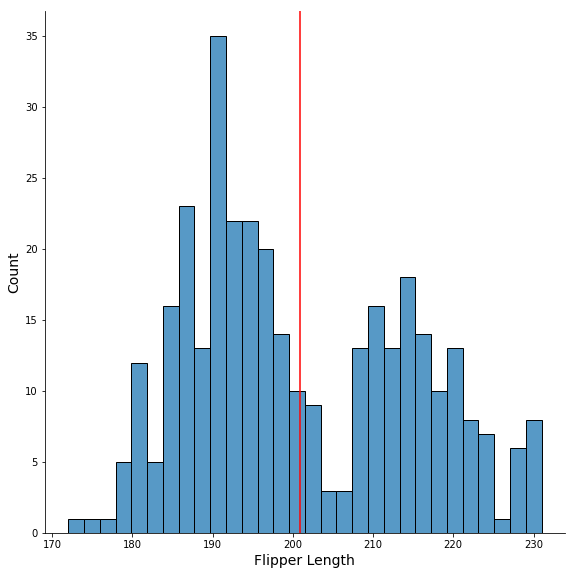
In this tutorial, we will learn how to add mean or median vertical line to a plot made with Seaborn’s displot() function. Seaborn’s displot() offers capability to visualize the univariate or bivariate distribution of data. Here we will make a histogram with Seaborn’s displot() and then see how to add median line to the histogram,… Continue reading How To Add Mean/Median Line to a Seaborn Displot
How To Add Dollar Sign on Axis Ticks in Matplotlib


In this tutorial, we will see examples of how to add dollar sign on axis ticks while making plots with Matplotlib in Python. While making plots to understand the relationship between currency like US dollars and other variables, it is better to show the Dollar symbol/sign on the axis ticks instead of numbers. Let us… Continue reading How To Add Dollar Sign on Axis Ticks in Matplotlib