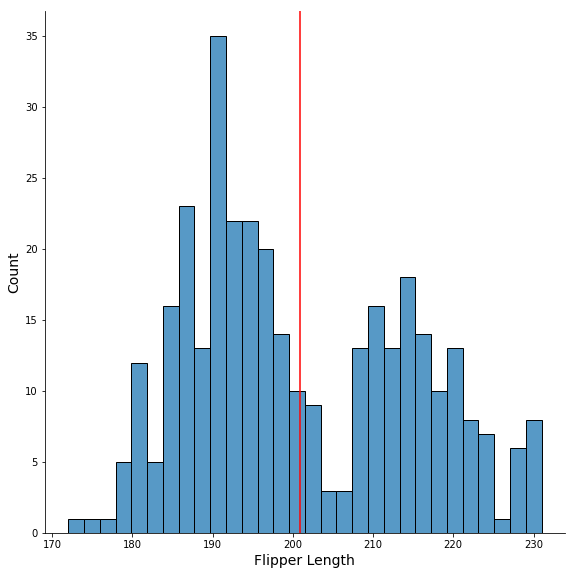
In this tutorial, we will learn how to add mean or median vertical line to a plot made with Seaborn’s displot() function. Seaborn’s displot() offers capability to visualize the univariate or bivariate distribution of data. Here we will make a histogram with Seaborn’s displot() and then see how to add median line to the histogram,… Continue reading How To Add Mean/Median Line to a Seaborn Displot
