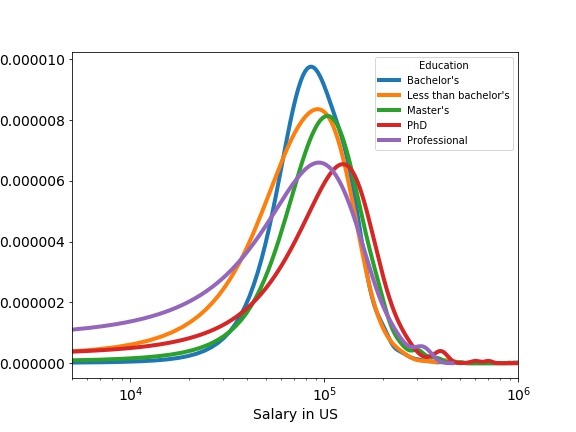
Often you may have data belonging to multiple groups. Visualizing them as multiple density plot is a great way to understand the similarities and differences between the groups. In this tutorial, we will learn how to make multi-density plot using Pandas in Python. We will use developer salary from US (from Stack Overflow survey) with… Continue reading Multiple Density Plots with Pandas in Python
