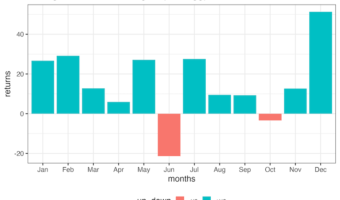
One of the most common frustrations for R beginners is plotting time-series data. You create a beautiful bar chart, but ggplot2 places April before January. Why does this happen? By default, R treats text variables (character strings) alphabetically. Since "A" comes before … [Read more...] about How to Order Months Chronologically in ggplot2 (Fixing Alphabetical Sort)
How to make axis tick label bold
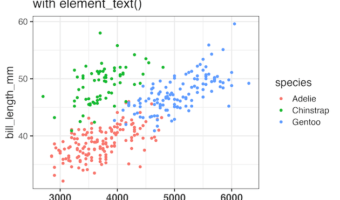
In this tutorial, you'll learn how to make axis tick labels bold in ggplot2 using the theme() function. Axis tick labels are the text that appears below x-axis and beside y-axis tick marks. Bold axis labels improve chart readability and make your data visualizations more … [Read more...] about How to make axis tick label bold
How to make Donut plot with ggplot2

In this tutorial, we will learn how to make a donut plot in R using ggplot2. Donut plot is nothing but a bar plot, reshaped into pie-chart, and then adding a hole at the center to make it look like a donut. We will learn these in step by step manner to understand making Donut … [Read more...] about How to make Donut plot with ggplot2
How to change axis tick label size in ggplot2

Are your ggplot2 axis tick labels too small to read in presentations, reports, or publications? Don’t worry—you’re not alone. In this step-by-step tutorial, you’ll learn how to change axis tick label size in ggplot2 using theme(), element_text(), and other customization options. … [Read more...] about How to change axis tick label size in ggplot2
How to make rolling mean line plot of stock data
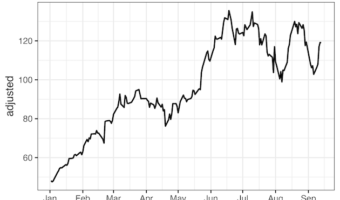
Want to smooth out erratic stock price fluctuations and spot the underlying trend? In this tutorial, you’ll learn how to compute and visualize a rolling mean (moving average) of stock prices in R using tidyquant, zoo package's rollmean(), and ggplot2. We’ll fetch Nvidia (NVDA) … [Read more...] about How to make rolling mean line plot of stock data