library(ggplot2)Let us make a data frame with two quantitative variables. We generate these variables using random numbers from normal/gaussian distribution.
set.seed(42)
x <- rnorm(2000, mean=15, sd=20)
y <- x+ rnorm(2000, mean=2, sd=30)
df <- data.frame(x=x, y=y)
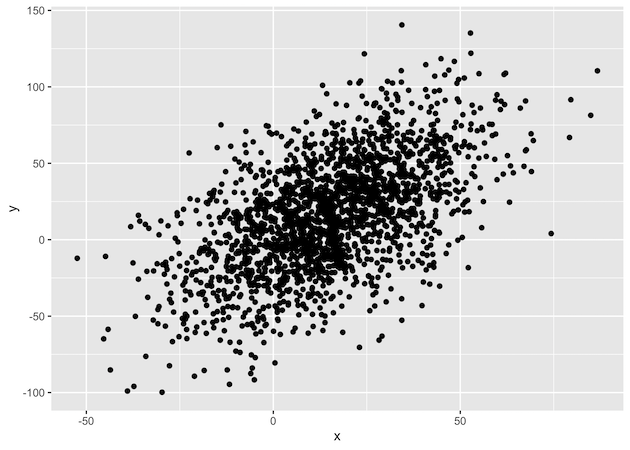
Let us make a simple scatter plot to illustrate the problem of overplotting
df %>%
  ggplot(aes(x=x, y=y)) + geom_point()

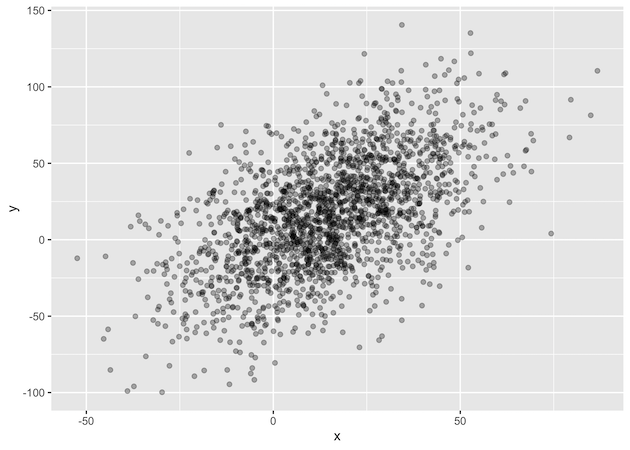
df %>%
 ggplot(aes(x=x,y=y)) + geom_point(alpha=0.3)


