
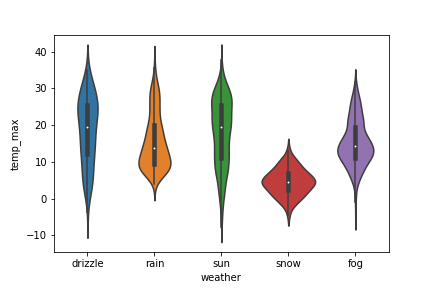
Violin plots are great way visualize continuous data distributions from multiple groups or categories. Violin plots are a lot like boxplot. Basically Violin plot is combination of boxplot and density plot. The shape of the density resembles a violin’s shape. Violinplot quickly shows the summary level stats of a numerical variable with multiple groups. 👉… Continue reading How to Make Violin Plot with Seaborn in Python?