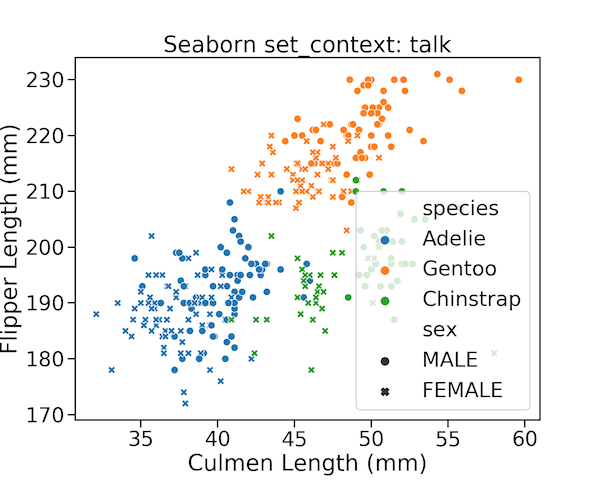
One of the challenges in making data visualization is making all aspects of a plot clearly visible. Often, you might see where the axis labels, tick labels are too small and not legible at all. Challenge is that the required sizes of plot aspects like labels, points, lines are not easy to set for different… Continue reading Seaborn set_context() to adjust size of plot labels and lines
