• Skip to primary navigation
  • Skip to main content
  • Skip to primary sidebar

Data Viz with Python and R

Learn to Make Plots in Python and R

  • Home
  • Seaborn
  • Matplotlib
  • ggplot2
  • Altair
  • About
    • Privacy Policy
  • Visualizing Activation Functions in Neural Networks
  • Confusion Matrix Calculator
  • Visualizing Dropout Rate in Neural Network
  • Visualizing Loss Functions in Neural Networks
  • Show Search
Hide Search

Highlight select boxplot

How to Highlight Select boxplot in ggplot2

datavizpyr · December 11, 2024 ·

Highlight select boxplot with specific color

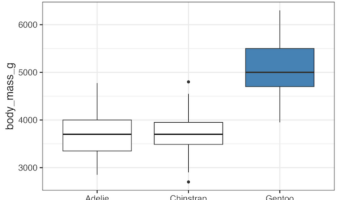
Need to emphasize specific groups or outliers in your boxplot visualizations? This comprehensive guide shows you exactly how to highlight and select boxplots in R using ggplot2, with step-by-step practical examples and customizable code snippets that work immediately. Boxplots … [Read more...] about How to Highlight Select boxplot in ggplot2

Filed Under: ggplot2, R Tagged With: Highlight select boxplot

Primary Sidebar

Python & R Viz Hubs

  • Seaborn Guide & Cookbook
  • ggplot2 Guide & Cookbook
  • Matplotlib Guide & Cookbook
  • Confusion Matrix Calculator
  • Visualizing Activation Functions
  • Visualizing Dropout
  • Visualizing Loss Functions

Buy Me a Coffee

Copyright © 2026 · Daily Dish Pro on Genesis Framework · WordPress · Log in

Go to mobile version