
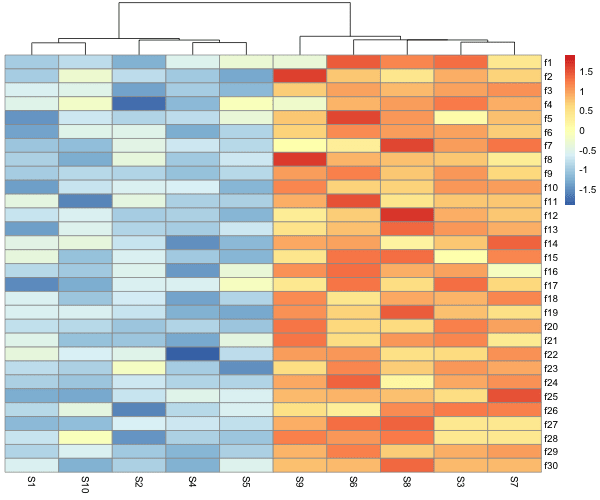
Heatmaps are one of the ways to visualize quantitative data in two dimension. Heatmaps show the actual data as colors and can reveal common patterns easily. In R, there are multiple ways to make heatmap starting from data in matrix form. In this post, we will learn how to make simple heatmaps with using pheatmap… Continue reading How to Make Heatmaps in R with pheatmap?