• Skip to primary navigation
  • Skip to main content
  • Skip to primary sidebar

Data Viz with Python and R

Learn to Make Plots in Python and R

  • Home
  • Seaborn
  • Matplotlib
  • ggplot2
  • Altair
  • About
    • Privacy Policy
  • Visualizing Activation Functions in Neural Networks
  • Confusion Matrix Calculator
  • Visualizing Dropout Rate in Neural Network
  • Visualizing Loss Functions in Neural Networks
  • Show Search
Hide Search

ggplot2 move legend to inside

How To Place Legend Inside the Plot with ggplot2?

datavizpyr · June 24, 2020 ·

Customizing Legend Inside Scatter Plot ggplot2

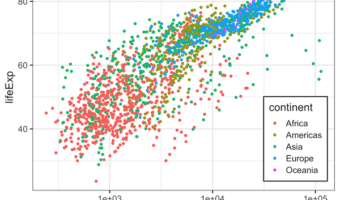
Need to save space or create more polished visualizations? This comprehensive guide shows you exactly how to place ggplot2 legend inside plot using multiple positioning methods, with ready-to-use code examples that work for any chart type. Default legend placement outside the … [Read more...] about How To Place Legend Inside the Plot with ggplot2?

Filed Under: ggplot2, R Tagged With: ggplot2 move legend to inside

Primary Sidebar

Python & R Viz Hubs

  • Seaborn Guide & Cookbook
  • ggplot2 Guide & Cookbook
  • Matplotlib Guide & Cookbook
  • Confusion Matrix Calculator
  • Visualizing Activation Functions
  • Visualizing Dropout
  • Visualizing Loss Functions

Buy Me a Coffee

Copyright © 2026 · Daily Dish Pro on Genesis Framework · WordPress · Log in

Go to mobile version