• Skip to primary navigation
  • Skip to main content
  • Skip to primary sidebar

Data Viz with Python and R

Learn to Make Plots in Python and R

  • Home
  • Python Viz
  • Seaborn
  • Altair
  • R Viz
  • ggplot2
  • About
    • Privacy Policy
  • Show Search
Hide Search

ggplot2 error

ggplot2 error: how to fix error in dataframe

datavizpyr · August 17, 2022 ·

How to fix Error in dataframe

In this post we will learn under what circumstances we will see a ggplot2 error that says something like "replacement has 9 rows, data has 8" in addition to other text that is not easily understood. We will also see an easy fix to such a difficult sounding error. Let us … [Read more...] about ggplot2 error: how to fix error in dataframe

Filed Under: ggplot2, R Tagged With: ggplot2 error, How to fix Error in dataframe

ggplot2 error: Cannot use `+.gg()` with a single argument.

datavizpyr · July 26, 2022 ·

How to fix the ggplot2_error: Did you accidentally put + on new line

In this post, we will learn how to fix one of the common ggplot2 error messages. While trying to make a ggplot2, we might get the following error. The error message here " Did you accidentally put + on a new line?" is bit helpful as it hints what is the cause of the error. … [Read more...] about ggplot2 error: Cannot use `+.gg()` with a single argument.

Filed Under: ggplot2, ggplot2 error, R Tagged With: ggplot2 error, ggplot2 error Cannot use `+.gg()`

Error in ggplot(): Mapping should be created with `aes()`

datavizpyr · July 17, 2022 ·

How to fix ggplot2 error: Mapping should be created with aes

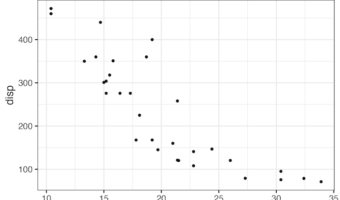
In this post we will see an example of one of most common errors while making a plot with ggplot2 and how to fix them. Let us we are trying to make a scatter plot using ggplot2 using the following code. Here we use mtcars dataset built-in R to make the scatter … [Read more...] about Error in ggplot(): Mapping should be created with `aes()`

Filed Under: ggplot2, R Tagged With: ggplot2 error

ggplot2 errot: how to fix could not find function “ggplot

datavizpyr · July 7, 2022 ·

How to fix Error in ggplot(., aes... could not find function ggplot

In this post we will learn how to fix one of the most common ggplot2 errors, saying "could not find function "ggplot"" Let us consider an example where we are trying to make boxplot using iris, one of the R built-in datasets. We have been extra careful and write a … [Read more...] about ggplot2 errot: how to fix could not find function “ggplot

Filed Under: ggplot2, R Tagged With: ggplot2 error, how to fix could not find function ggplot

Primary Sidebar

Tags

Altair barplot Boxplot boxplot python boxplot with jiitered text labels Bubble Plot Color Palette Countplot Density Plot Facet Plot gganimate ggplot2 ggplot2 Boxplot ggplot2 error ggplot boxplot ggridges ggtext element_markdown() Grouped Barplot R heatmap heatmaps Histogram Histograms Horizontal boxplot Python lollipop plot Maps Matplotlib Pandas patchwork pheatmap Pyhon Python R RColorBrewer reorder boxplot ggplot Ridgeline plot Scatter Plot Scatter Plot Altair Seaborn Seaborn Boxplot Stock Price Over Time Stripplot UpSetR Violinplot Violin Plot World Map ggplot2

Buy Me a Coffee

Copyright © 2025 · Daily Dish Pro on Genesis Framework · WordPress · Log in

Go to mobile version