• Skip to primary navigation
  • Skip to main content
  • Skip to primary sidebar

Data Viz with Python and R

Learn to Make Plots in Python and R

  • Home
  • Seaborn
  • Matplotlib
  • ggplot2
  • Altair
  • About
    • Privacy Policy
  • Visualizing Activation Functions in Neural Networks
  • Confusion Matrix Calculator
  • Visualizing Dropout Rate in Neural Network
  • Visualizing Loss Functions in Neural Networks
  • Show Search
Hide Search

ggbump ggplot2 extension

Bump Plot with ggbump

datavizpyr · March 28, 2022 ·

Customizing Bump Plot made with ggbump

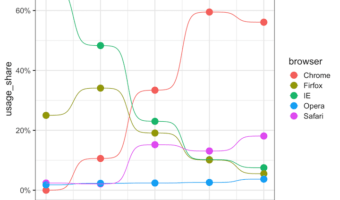
Bump plots are line plots with dots showing the data points. Bump plots can be useful in understanding the change in rank over time. In this tutorial, we will learn how to make bump plots using ggbump package, a ggplot2 extension package. To make a bump plot we will use the … [Read more...] about Bump Plot with ggbump

Filed Under: ggplot2, R Tagged With: bump plot with ggbump, ggbump ggplot2 extension

Primary Sidebar

Python & R Viz Hubs

  • Seaborn Guide & Cookbook
  • ggplot2 Guide & Cookbook
  • Matplotlib Guide & Cookbook
  • Confusion Matrix Calculator
  • Visualizing Activation Functions
  • Visualizing Dropout
  • Visualizing Loss Functions

Buy Me a Coffee

Copyright © 2026 · Daily Dish Pro on Genesis Framework · WordPress · Log in

Go to mobile version