• Skip to primary navigation
  • Skip to main content
  • Skip to primary sidebar

Data Viz with Python and R

Learn to Make Plots in Python and R

  • Home
  • Seaborn
  • Matplotlib
  • ggplot2
  • Altair
  • About
    • Privacy Policy
  • Visualizing Activation Functions in Neural Networks
  • Confusion Matrix Calculator
  • Visualizing Dropout Rate in Neural Network
  • Visualizing Loss Functions in Neural Networks
  • Show Search
Hide Search

geom_lollipop() ggalt

Lollipop plot with ggplot extension ggalt

datavizpyr · January 4, 2023 ·

Customizing lollipop. plot with geom_lollipop() in ggalt

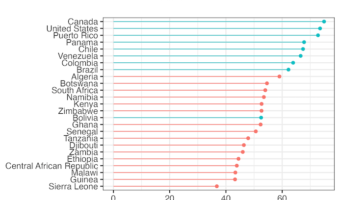
Creating a lollipop plot with ggalt is an excellent way to visualize ranked data with minimal ink usage compared to traditional bar charts. The ggalt package extends ggplot2 functionality with geom_lollipop(), making it easy to create elegant stick-and-circle visualizations that … [Read more...] about Lollipop plot with ggplot extension ggalt

Filed Under: ggplot2, R, Uncategorized Tagged With: geom_lollipop() ggalt, lollipop plot in R

Primary Sidebar

Python & R Viz Hubs

  • Seaborn Guide & Cookbook
  • ggplot2 Guide & Cookbook
  • Matplotlib Guide & Cookbook
  • Confusion Matrix Calculator
  • Visualizing Activation Functions
  • Visualizing Dropout
  • Visualizing Loss Functions

Buy Me a Coffee

Copyright © 2026 · Daily Dish Pro on Genesis Framework · WordPress · Log in

Go to mobile version