• Skip to primary navigation
  • Skip to main content
  • Skip to primary sidebar

Data Viz with Python and R

Learn to Make Plots in Python and R

  • Home
  • Seaborn
  • Matplotlib
  • ggplot2
  • Altair
  • About
    • Privacy Policy
  • Visualizing Activation Functions in Neural Networks
  • Confusion Matrix Calculator
  • Visualizing Dropout Rate in Neural Network
  • Visualizing Loss Functions in Neural Networks
  • Show Search
Hide Search

arrange months in right order

How to Order Months Chronologically in ggplot2 (Fixing Alphabetical Sort)

datavizpyr · November 21, 2024 ·

Arranging months in right order with ggplot2

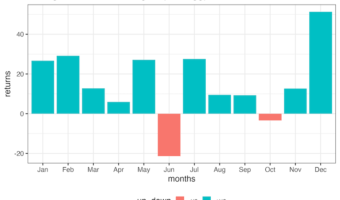
One of the most common frustrations for R beginners is plotting time-series data. You create a beautiful bar chart, but ggplot2 places April before January. Why does this happen? By default, R treats text variables (character strings) alphabetically. Since "A" comes before … [Read more...] about How to Order Months Chronologically in ggplot2 (Fixing Alphabetical Sort)

Filed Under: ggplot2, R Tagged With: arrange months in right order

Primary Sidebar

Python & R Viz Hubs

  • Seaborn Guide & Cookbook
  • ggplot2 Guide & Cookbook
  • Matplotlib Guide & Cookbook
  • Confusion Matrix Calculator
  • Visualizing Activation Functions
  • Visualizing Dropout
  • Visualizing Loss Functions

Buy Me a Coffee

Copyright © 2026 · Daily Dish Pro on Genesis Framework · WordPress · Log in

Go to mobile version