• Skip to primary navigation
  • Skip to main content
  • Skip to primary sidebar

Data Viz with Python and R

Learn to Make Plots in Python and R

  • Home
  • Seaborn
  • Matplotlib
  • ggplot2
  • Altair
  • About
    • Privacy Policy
  • Visualizing Activation Functions in Neural Networks
  • Confusion Matrix Calculator
  • Visualizing Dropout Rate in Neural Network
  • Visualizing Loss Functions in Neural Networks
  • Show Search
Hide Search

add text annotation with annotate()

Adding and Troubleshooting Text Annotations on a plot with ggplot2

datavizpyr · November 10, 2021 ·

Illustrating Text Annotation Troubles

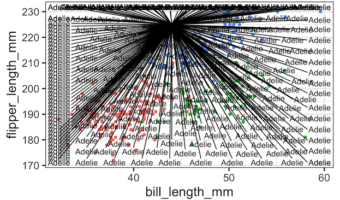
Adding text annotations to a plot can greatly help understanding a plot better. In this tutorial, we will learn couple of examples of adding text annotations to a scatter plot with three groups of samples. First we see couple of examples of what might typically go wrong while … [Read more...] about Adding and Troubleshooting Text Annotations on a plot with ggplot2

Filed Under: ggplot2, R Tagged With: add text annotation with annotate()

Primary Sidebar

Python & R Viz Hubs

  • Seaborn Guide & Cookbook
  • ggplot2 Guide & Cookbook
  • Matplotlib Guide & Cookbook
  • Confusion Matrix Calculator
  • Visualizing Activation Functions
  • Visualizing Dropout
  • Visualizing Loss Functions

Buy Me a Coffee

Copyright © 2026 · Daily Dish Pro on Genesis Framework · WordPress · Log in

Go to mobile version