• Skip to primary navigation
  • Skip to main content
  • Skip to primary sidebar

Data Viz with Python and R

Learn to Make Plots in Python and R

  • Home
  • Seaborn
  • Matplotlib
  • ggplot2
  • Altair
  • About
    • Privacy Policy
  • Visualizing Activation Functions in Neural Networks
  • Confusion Matrix Calculator
  • Visualizing Dropout Rate in Neural Network
  • Visualizing Loss Functions in Neural Networks
  • Show Search
Hide Search

add matching color in title

How to Add matching colors to keywords in title text

datavizpyr · July 9, 2024 ·

Add matching colors to keywords in ggplot2 title text with ggtext

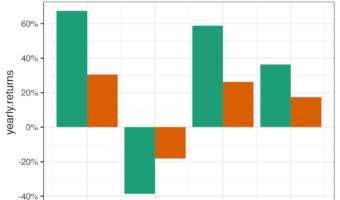
This tutorial teaches you how to color words in a ggplot title to match the data in the plot itself. This approach has two main benefits: Improves interpretation: Readers can understand the chart more quickly. Reduces clutter: It can eliminate the need for a … [Read more...] about How to Add matching colors to keywords in title text

Filed Under: ggplot2, ggtext, R Tagged With: add matching color in title

Primary Sidebar

Python & R Viz Hubs

  • Seaborn Guide & Cookbook
  • ggplot2 Guide & Cookbook
  • Matplotlib Guide & Cookbook
  • Confusion Matrix Calculator
  • Visualizing Activation Functions
  • Visualizing Dropout
  • Visualizing Loss Functions

Buy Me a Coffee

Copyright © 2026 · Daily Dish Pro on Genesis Framework · WordPress · Log in

Go to mobile version