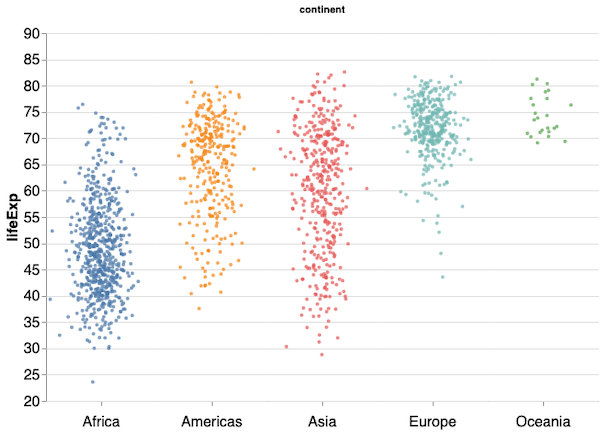
In this post we will learn how to make strip plots using Altair in Python. A simple strip plot is plotting the data as points and may not that useful. One way to make the simple striplplot more meaningful is to add random jitter. Making a stipplot with jitter in Altair is slightly tricky. Luckily, came across this sample code to make stripplot in Altair website. This post is step-by-step illustration and walk through of the example that starts with simple stripplot and progressively iterate through a better stripplot with jitter.
Let us first import Altair and Pandas to make stripplot with Altair.
import altair as alt
import pandas as pd
We will use gapminder data to make stripplots of lifeExp across all continents.
data_url = 'http://bit.ly/2cLzoxH'
gapminder = pd.read_csv(data_url)
gapminder.head()

country	year	pop	continent	lifeExp	gdpPercap
0	Afghanistan	1952	8425333.0	Asia	28.801	779.445314
1	Afghanistan	1957	9240934.0	Asia	30.332	820.853030
2	Afghanistan	1962	10267083.0	Asia	31.997	853.100710
Simple Stripplot with Altair
Let us start with simple jitter plot in Altair. We can make stripplot using mark_circle() as shown below.
alt.Chart(gapminder).mark_circle().encode(
    x='continent:O',
    y='lifeExp:Q',
    color="continent"
).properties(width=500)
We get a simple stripplot like this.
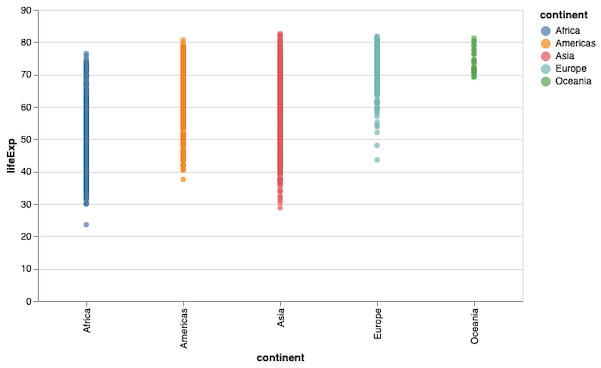
One can immediately see the problem of overplotting with most of the points overlapping on each other. We will begin with the simple stripplot and work towards making it better. At first let us remove the legend in the stripplot above as it is the same as the values on x-axis, therefore redundant.
How to Remove Legend in Altair?
We can remove the legend in Altair using legend=None argument inside alt.Color() function.
alt.Chart(gapminder).mark_circle().encode(
    x='continent:O',
    y='lifeExp:Q',
    color=alt.Color('continent:N', legend=None),
).properties(width=600)
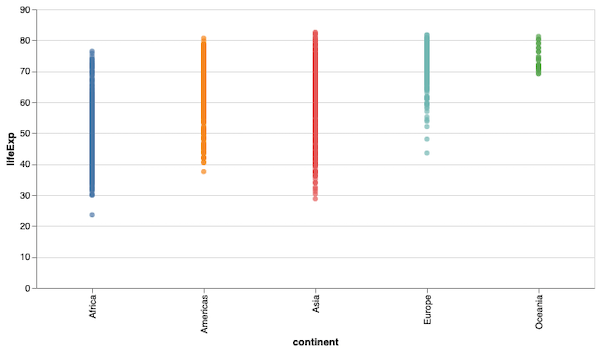
We get the same stripplot, but now it is without legend for the colors for values on x-axis.
Stripplot with Jitter in Altair: First Try
We kind of know that we need to add jitter to the variable on x-axis in the strippplot. As a first try, let us use alt.X() with jitter option. In addition to jitter, we also specify other options with in alt.X(). In Altair, we also have to specify a function to compute how much random noise to add in the jittered stripplot. Here, we have used transform_calcluate() function with a function for jitter as argument.
stripplot =  alt.Chart(gapminder, width=60).mark_circle(size=8).encode(
    x=alt.X(
        'jitter:Q',
        title=None,
        axis=alt.Axis(values=[0], ticks=True, grid=False, labels=False),
        scale=alt.Scale(),
    ),
    y=alt.Y('lifeExp:Q'),
    color=alt.Color('continent:N', legend=None),
  ).transform_calculate(
    # Generate Gaussian jitter with a Box-Muller transform
    jitter='sqrt(-2*log(random()))*cos(2*PI*random())'
)
stripplot
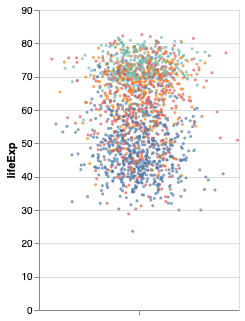
Let us check how does the stripplot looks like now. It seems we have successfully added jitter to data points. However, we don’t have each of continent separate in the jittered stripplot.
Stripplot with Jitter in Altair: Second Try with alt.Column()
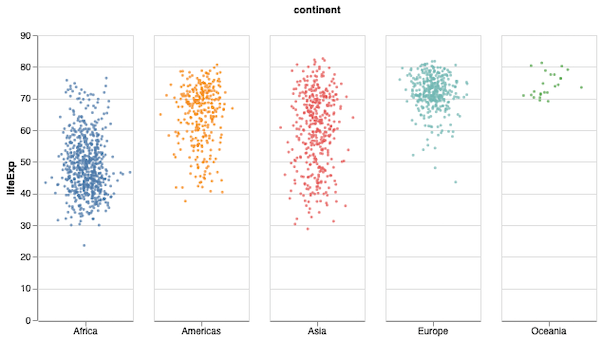
Altair has the option of specifying which variable should be arranged in separate column with alt.Column(). Here, the continent values should be on separate columns. With alt.Column(), we also specify header and label information and locations with header argument.
stripplot =  alt.Chart(gapminder, width=60).mark_circle(size=8).encode(
    x=alt.X(
        'jitter:Q',
        title=None,
        axis=alt.Axis(values=[0], ticks=True, grid=False, labels=False),
        scale=alt.Scale(),
    ),
    y=alt.Y('lifeExp:Q'),
    color=alt.Color('continent:N', legend=None),
    column=alt.Column(
        'continent:N',
        header=alt.Header(
            labelAngle=0,
            titleOrient='top',
            labelOrient='bottom',
            labelAlign='center',
            labelPadding=10,
        ),
    ),
).transform_calculate(
    # Generate Gaussian jitter with a Box-Muller transform
    jitter='sqrt(-2*log(random()))*cos(2*PI*random())'
)
stripplot
Now we get a much better looking stripplot with jitter. And each continent’s distribution is in a separate column with a heading.
Stripplot with Jitter in Altair: Remove Space Between Columns
Although the stripplot with jitter looks great, we can notice that the spacing between the columns makes the plot looks more like a facet plot. With Altair, we can adjust the spacing with “configure_facet(spacing=0)” option.
stripplot =  alt.Chart(gapminder, width=120).mark_circle(size=8).encode(
    x=alt.X(
        'jitter:Q',
        title=None,
        axis=alt.Axis(values=[0], ticks=True, grid=False, labels=False),
        scale=alt.Scale(),
    ),
    y=alt.Y('lifeExp:Q'),
    color=alt.Color('continent:N', legend=None),
    column=alt.Column(
        'continent:N',
        header=alt.Header(
            labelAngle=0,
            titleOrient='top',
            labelOrient='bottom',
            labelAlign='center',
            labelPadding=10,
        ),
    ),
).transform_calculate(
    # Generate Gaussian jitter with a Box-Muller transform
    jitter='sqrt(-2*log(random()))*cos(2*PI*random())'
).configure_facet(
    spacing=0
)
stripplot
There is no spacing between the columns of the stripplot with jitter now. However, we have a verticle lines separating each column.

Stripplot with Jitter in Altair: Remove Vertical Lines Between Columns
Let us remove the vertical lines separating the columns using configure_view(stroke=None).
stripplot =  alt.Chart(gapminder, width=120).mark_circle(size=8).encode(
    x=alt.X(
        'jitter:Q',
        title=None,
        axis=alt.Axis(values=[0], ticks=True, grid=False, labels=False),
        scale=alt.Scale(),
    ),
    y=alt.Y('lifeExp:Q'),
    color=alt.Color('continent:N', legend=None),
    column=alt.Column(
        'continent:N',
        header=alt.Header(
            labelAngle=0,
            titleOrient='top',
            labelOrient='bottom',
            labelAlign='center',
            labelPadding=10,
        ),
    ),
).transform_calculate(
    # Generate Gaussian jitter with a Box-Muller transform
    jitter='sqrt(-2*log(random()))*cos(2*PI*random())'
).configure_facet(
    spacing=0
).configure_view(
    stroke=None
)
stripplot
We have now removed the vertical lines and our stripplot with jitter looks perpect except for the font sizes of axis ticks and labels.

Stripplot with Jitter in Altair: Increase the font size
We can increase font sizes with configure_axis() in Altair.
stripplot =  alt.Chart(gapminder).mark_circle(size=14).encode(
    x=alt.X(
        'jitter:Q',
        title=None,
        axis=alt.Axis(values=[0], ticks=True, grid=False, labels=False),
        scale=alt.Scale(),
    ),
    y=alt.Y('lifeExp:Q',
           scale=alt.Scale(
            domain=(20,90))),
    color=alt.Color('continent:N', legend=None),
    column=alt.Column(
        'continent:N',
        header=alt.Header(
            labelFontSize=16,
            labelAngle=0,
            titleOrient='top',
            labelOrient='bottom',
            labelAlign='center',
            labelPadding=25,
        ),
    ),
).transform_calculate(
    # Generate Gaussian jitter with a Box-Muller transform
    jitter='sqrt(-2*log(random()))*cos(2*PI*random())'
).configure_facet(
    spacing=0
).configure_view(
    stroke=None
).configure_axis(
    labelFontSize=16,
    titleFontSize=16
).properties(height=400, width=100)
stripplot
And finally we have a nice stripplot with jitter as we originally intended to. Hurray!
