Stripplots are like scatter plots but one of the variables is a categorical variable. Stripplots are a great addition to boxplots as it shows complete data on the plot. Stripplots are more useful when can add random noise called “jitter” to avoid overlapping of data points with same values. In this post, we will learn how to make stripplot with jitter using Seaborn’s Catplot function.
Let us first load Seaborn and other python libraries useful for making stripplots.
import seaborn as sns
import matplotlib.pyplot as plt
import pandas as pd
import numpy as np
We will generate data to make stripplot with jitter using Seaborn’s Catplot function. We use NumPy’s random module to simulate data for making the stripplot.
np.random.seed(42)
# Generating Data
df = pd.DataFrame({
    'Morocco': np.random.normal(57, 5,100),
    'USA': np.random.normal(73, 5, 100),
    'Jamaica': np.random.normal(68, 8,100),
    'Sierra Leone': np.random.normal(37, 10, 100),
    'Iceland': np.random.normal(76, 5, 100)
  })
Our data looks like this. It is in wide form with multiple countries’ life expectancy in each column.
print(df.head())
     Morocco        USA    Jamaica  Sierra Leone    Iceland
0  59.483571  65.923146  70.862299     28.710050  68.027862
1  56.308678  70.896773  72.486276     31.398190  73.003125
2  60.238443  71.286427  76.664410     44.472936  76.026218
3  64.615149  68.988614  76.430416     43.103703  76.234903
4  55.829233  72.193571  56.978645     36.790984  73.749673
Stripplot with Seaborn Catplot using Data in Wide form
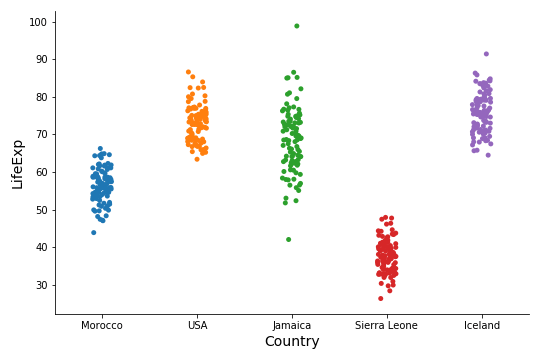
Seaborn’s Catplot function is versatile in making plots involving categorical variables. For example, Catplot can take in data in wide form and make stripplot. To make stripplot with jitter using Catplot, we simply provide the data in wiode form with kind=”strip” argument.
sns.catplot(data=df, kind="strip");
plt.xlabel("Country",size=14)
plt.ylabel("LifeExp",size=14)
plt.savefig("Stripplot_using_Seaborn_Catplot_with_wide_data_Python.png")
And we get a nice stripplot with jitter automatically coloring different groups.
Stripplot with Seaborn Catplot using Data in tidy/long form
Often, working with data in tidy for is lot easier and here we will see an example of making stripplot with data in tidy long form
Our data in this example is in wide form. Let us first convert the data to tidy long form using Pandas’s melt function.
df_long = pd.melt(df, var_name="country", value_name="lifeExp")
df_long.head()
Our data in tidy long form contains two variables; conutry and lifeExp
df_long.head()
country	lifeExp
0	Morocco	59.483571
1	Morocco	56.308678
2	Morocco	60.238443
3	Morocco	64.615149
4	Morocco	55.829233
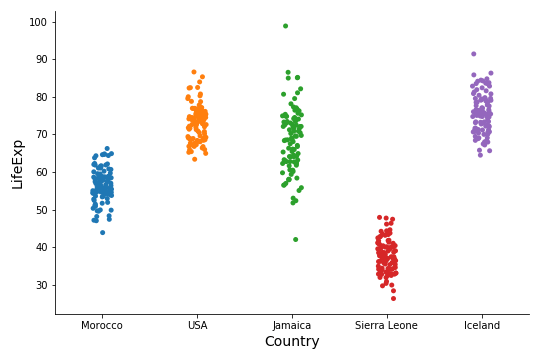
With the tidy data, we can use Seaborn’s catplot function to make stripplot with jitter. Now, we need to specify the two variables for x and y-axis with kind=”strip”.
sns.catplot(data=df_long, x= 'country', y='lifeExp', kind="strip")
plt.xlabel("Country",size=14)
plt.ylabel("LifeExp",size=14)
plt.savefig("Stripplot_using_Seaborn_Catplot_with_long_data_Python.png")
We get stripplot that looks the same as the one we made with data in wide form using Seaborn’s catplot.