Last updated on October 27, 2025
Why Reorder Boxplots in ggplot2?
By default, ggplot2 arranges categorical variables alphabetically.
Reordering boxplots by a numeric summary (mean or median) helps highlight
patterns—like which airlines fly fastest on average. This makes your
visualization more interpretable and presentation-ready.
In this post, we will learn how to re-order boxplots in R with ggplot2. We will make a boxplot using ggplot2 with multiple groups. We will see multiple examples of reordering boxplots by another variable in the data using reorder() function in base R.
Quick Reference: How to Reorder Boxplots in ggplot2
| Goal | Function | Package | Example |
|---|---|---|---|
| Default (alphabetical) | aes(x = carrier) |
Base R | Alphabetical order of factor levels |
| Reorder ascending | reorder() |
Base R | aes(x = reorder(carrier, speed)) |
| Reorder descending | reorder() |
Base R | aes(x = reorder(carrier, -speed)) |
| Handle missing values | reorder() |
Base R | aes(x = reorder(carrier, speed, na.rm = TRUE)) |
| Reorder with more control | fct_reorder() |
forcats |
aes(x = fct_reorder(carrier, speed, .fun = mean, .na_rm = TRUE)) |
| Reorder descending (tidyverse) | fct_reorder() |
forcats |
aes(x = fct_reorder(carrier, speed, .desc = TRUE)) |
| Custom multi-variable order | fct_relevel() |
forcats |
mutate(carrier = fct_relevel(carrier, custom_levels)) |
Tip: Use fct_reorder() for tidyverse pipelines or when you need explicit control (.fun, .desc, .na_rm). Use fct_relevel() when you already computed a custom level order from summarized data.
Load Data and tidyverse
We will use NYC flights data set for the year 2013 to make boxplot. We can get the flights data from R pacakge nycflights13.
Let us load tidyverse and nycflights13 package.
library(tidyverse)
library(nycflights13)
theme_set(theme_bw(base_size=16))
The flights data frame contains multiple details about the flights departed from three NYC area airports.
flights |> colnames()

##  [1] "year"           "month"          "day"            "dep_time"
##  [5] "sched_dep_time" "dep_delay"      "arr_time"       "sched_arr_time"
##  [9] "arr_delay"      "carrier"        "flight"         "tailnum"
## [13] "origin"         "dest"           "air_time"       "distance"
## [17] "hour"           "minute"         "time_hour"
Let us select a few variables from flights dataframe and estimate flight speed from distance and air_time.
flights_speed <- flights %>%
  select(carrier, distance, air_time)%>%
  mutate(speed=distance/air_time)
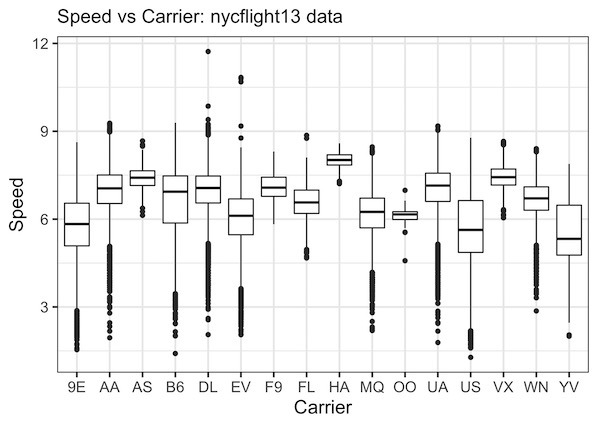
Default Boxplot with groups in alphabetical order using ggplot2
We will make boxplot of speed for each of airline carrier to understand the relationship between speed and carrier.
flights_speed |> head()

## # A tibble: 6 x 4
##   carrier distance air_time speed
##   <chr>      <dbl>    <dbl> <dbl>
## 1 UA          1400      227  6.17
## 2 UA          1416      227  6.24
## 3 AA          1089      160  6.81
## 4 B6          1576      183  8.61
## 5 DL           762      116  6.57
## 6 UA           719      150  4.79
We can make boxplot in R with geom_boxplot() function in ggplot2.
flights_speed |>
  ggplot(aes(x=carrier, y=speed)) +
  geom_boxplot() +
  labs(y="Speed", x="Carrier", subtitle="Speed vs Carrier: nycflight13 data")
We can see that boxplot made by ggplot is ordered in alphabetical order of names the airline carriers. With so many carriers on x-axis it is not easy to identify carriers with higher average speed or lower speed.
1. Reordering boxplots using reorder() in R
A better solution is to reorder the boxes of boxplot by median or mean values of speed. In R we can re-order boxplots in multiple ways. In this example, we will use the function reorder() in base R to re-order the boxes. We use reorder() function, when we specify x-axis variable inside the aesthetics function aes(). reorder() function sorts the carriers by mean values of speed by default.
flights_speed |>
  ggplot(aes(x=reorder(carrier,speed), y=speed)) +
  geom_boxplot() +
  labs(y="Speed", x="Carrier",
       subtitle="Sorting Boxplots with missing data")
2. Reordering boxplots in R: Error due to missing values
When we executed the above code chunk, we should have gotten reordered boxplots. Instead we got a boxplot that is till unordered.
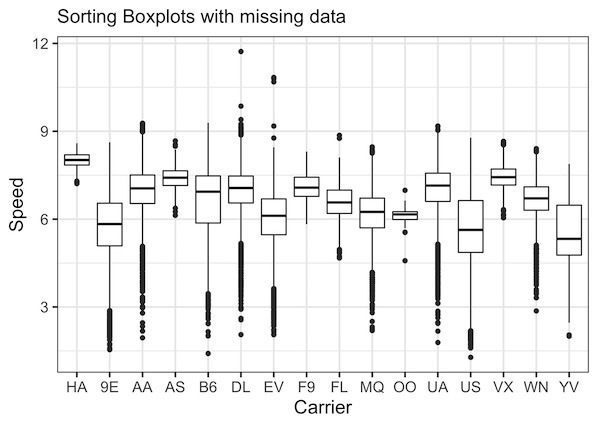
The reason is missing data in our flights_speed data frame. We also see the following warning when we made the plot.
>Removed 9430 rows containing non-finite values (stat_boxplot).
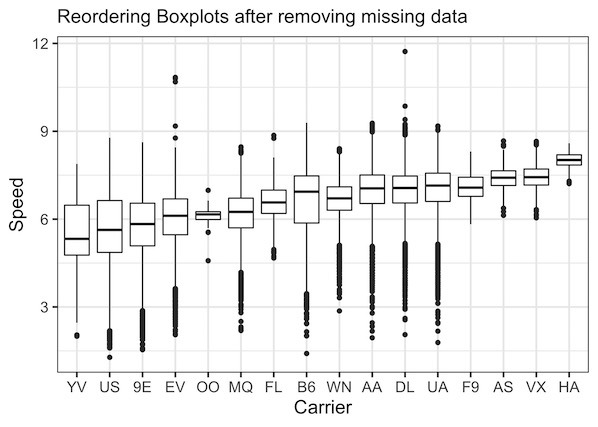
We need to specify within reorder() function to remove the data with missing values using na.rm=TRUE.
flights_speed |>
  ggplot(aes(x=reorder(carrier,speed,na.rm = TRUE), y=speed)) +
  geom_boxplot() +
  labs(y="Speed", x="Carrier",
       subtitle="Reordering Boxplots after removing missing data")
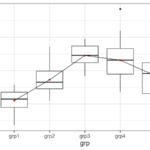
Now we have reordered boxplot. By default, it is re-ordered in ascending order.
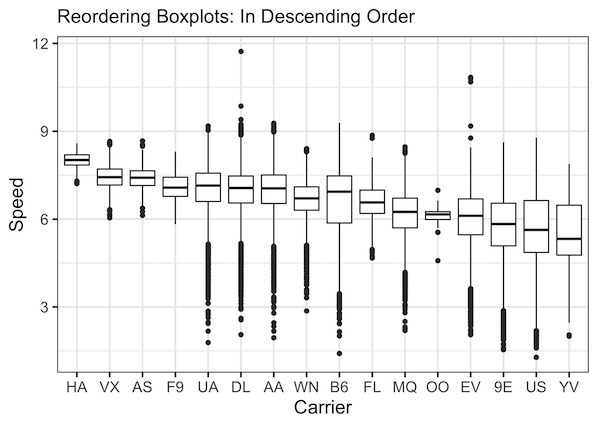
3. Reordering boxplots in descending order
To sort boxes in boxplot in descending order, we add negation to speed within reorder() function.
flights_speed |>
  ggplot(aes(x=reorder(carrier,-speed, na.rm = TRUE), y=speed)) +
  geom_boxplot() +
  labs(y="Speed", x="Carrier",
       subtitle="Reordering Boxplots: In Descending Order")
Now have reordered boxplots in descending order.
Reordering Boxplots in ggplot2 using forcats::fct_reorder()
While reorder() from base R works well, the forcats package (part of the tidyverse) provides a more readable and robust way to reorder factors inside ggplot2. The function fct_reorder() is designed for exactly this purpose — it reorders factor levels based on another variable.
# Reorder boxplots using forcats::fct_reorder()
flights_speed |>
  ggplot(aes(x = fct_reorder(carrier,
                             speed,
                            .fun = mean,
                            .na_rm = TRUE),
             y = speed)) +
  geom_boxplot() +
  labs(x = "Carrier",
       y = "Speed (miles/minute)",
       subtitle = "Reordering Boxplots in ggplot2 using fct_reorder()") +
  theme(legend.position = "none")
Here, fct_reorder(carrier, speed) reorders carriers based on the mean speed. .fun = mean explicitly tells R to use the mean (you can change to median or another function). .na_rm = TRUE safely removes missing values. The resulting boxplot displays carriers from lowest to highest mean flight speed.
na.rm = TRUE inreorder() causes boxplots to stay unordered. Always remove missingvalues when sorting by a computed variable.
Frequently Asked Questions
1. How do I reorder boxplots in ggplot2 by median?
Use reorder(carrier, speed, FUN = median) or fct_reorder(carrier, speed, .fun = median) to sort by median instead of mean.
2. How do I sort boxplots in descending order?
Add a minus sign before your numeric variable in reorder(), or set .desc = TRUE inside fct_reorder().
3. Why is my boxplot not reordered?
Missing values prevent sorting. Add na.rm = TRUE (for reorder()) or .na_rm = TRUE (for fct_reorder()).
4. What is the difference between reorder() and fct_reorder() in ggplot2?
reorder() is a base R function that works well for quick plots. fct_reorder() from the forcats package is part of the tidyverse and gives more control — you can set .fun, .desc, and .na_rm arguments explicitly. For new ggplot2 code, fct_reorder() is preferred for clarity and consistency.