Often one might be interested in quickly visualizing the relationship between one categorical vs all numerical variables in a dataframe. We can make multiple boxplots between one categorical variable against all the numerical variables on the dataframe at the same time.
In this post we will consider a simple example where our dataframe contains one qualitative column and multiple quantitative columns. And use pivot_wrap() to make a single plot containing multiple boxplots.
First, let us load the packages needed. We will use Palmer Penguins dataset to make the boxplots between species variable vs numerical variables.
library(tidyverse)
library(palmerpenguins)
theme_set(theme_bw(16))
Penguins data set looks like this.
penguins %>%
  head()

# A tibble: 6 × 8
  species island    bill_length_mm bill_depth_mm flipper_length_mm body_mass_g
  <fct>   <fct>              <dbl>         <dbl>             <int>       <int>
1 Adelie  Torgersen           39.1          18.7               181        3750
2 Adelie  Torgersen           39.5          17.4               186        3800
3 Adelie  Torgersen           40.3          18                 195        3250
4 Adelie  Torgersen           NA            NA                  NA          NA
5 Adelie  Torgersen           36.7          19.3               193        3450
6 Adelie  Torgersen           39.3          20.6               190        3650
# 2 more variables: sex <fct>, year <int>
Let us simplify the data so that it contains only one categorical variable, here species, and multiple numerical variables.
penguins_df <-
  penguins %>%
  select(-sex, -island, -year)
penguins_df %>%
  head()

# A tibble: 6 × 5
  species bill_length_mm bill_depth_mm flipper_length_mm body_mass_g
  <fct>            <dbl>         <dbl>             <int>       <int>
1 Adelie            39.1          18.7               181        3750
2 Adelie            39.5          17.4               186        3800
3 Adelie            40.3          18                 195        3250
4 Adelie            NA            NA                  NA          NA
5 Adelie            36.7          19.3               193        3450
6 Adelie            39.3          20.6               190        3650
Multiple Boxplots at the same time
One way to make multiple boxplots at the same time is to use tidy the data using pivot_longer() and then use facet_wrap() to make multiple plots in the same plot. We can tidy up the data by using pivot_longer() function to create a long form dataframe with three columns.
penguins_long <- penguins_df %>%
  pivot_longer(-species, names_to = "feature_name",
               values_to = "feature_value")
penguins_long %>% head()

# A tibble: 6 × 3
  species feature_name      feature_value
  <fct>   <chr>                     <dbl>
1 Adelie  bill_length_mm             39.1
2 Adelie  bill_depth_mm              18.7
3 Adelie  flipper_length_mm         181
4 Adelie  body_mass_g              3750
5 Adelie  bill_length_mm             39.5
6 Adelie  bill_depth_mm              17.4
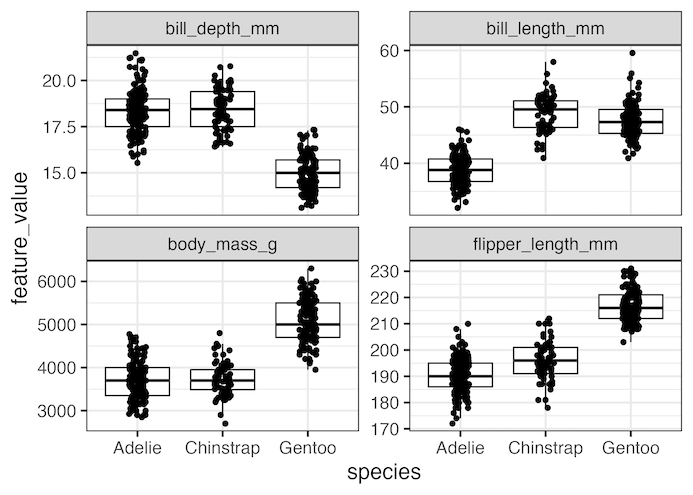
Now that the data is tidy/longer, we can make multiple boxplots in the same figure using facet_wrap() function.
penguins_long %>%
  ggplot(aes(x=species, y=feature_value)) +
  geom_boxplot(outlier.shape = NA)+
  geom_jitter(width=0.1)+
  facet_wrap(~feature_name,scales="free_y")+
  theme(legend.position = "none")
ggsave("boxplot_between_one_categorical_vs_all_numerical_variables.png")
Here we customize the plot by coloring by the categorical variable.
penguins_long %>%
  ggplot(aes(x=species, y=feature_value, color=species)) +
  geom_boxplot(outlier.shape = NA)+
  geom_jitter(width=0.1)+
  facet_wrap(~feature_name,scales="free_y")+
  theme(legend.position = "none")
ggsave("boxplot_between_one_categorical_variable_vs_all_numerical.png")

Explore the Complete ggplot2 Guide
35+ tutorials with code: scatterplots, boxplots, themes, annotations, facets, and more—tested and beginner-friendly.
Visit the ggplot2 Hub → No fluff—just code and visuals.


