In this post we will see example of plotting multiple histograms on the same plot using Matplotlib in Python.
Let us first load Matplotlib and numpy to make overlapping histograms with Matplotlib in Python.
import matplotlib.pyplot as plt
import numpy as np
We will simulate data using NumPy’s random module. First we create two numerical variables from gaussian normal distribution with specified mean using Numpy.
# set seed for reproducing
np.random.seed(42)
n = 5000
mean_mu1 = 60
sd_sigma1 = 15
data1 = np.random.normal(mean_mu1, sd_sigma1, n)
mean_mu2 = 80
sd_sigma2 = 15
data2 = np.random.normal(mean_mu2, sd_sigma2, n)
Overlapping histograms with 2 variables/groups using matplotlib
Earlier, we learned how to make single histogram with hist() function in Matplotlib with pyplot. To make multiple overlapping histograms, we need to use Matplotlib pyplot’s hist function multiple times.
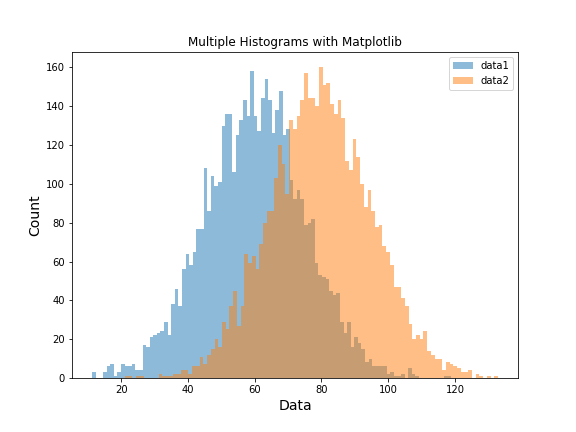
For example, to make a plot with two histograms, we need to use pyplot’s hist() function two times. Here we adjust the transparency with alpha parameter and specify a label for each variable.
plt.figure(figsize=(8,6))
plt.hist(data1, bins=100, alpha=0.5, label="data1")
plt.hist(data2, bins=100, alpha=0.5, label="data2")
Here we customize our plot with two histograms with larger labels, title and legend using the label we defined.
plt.xlabel("Data", size=14)
plt.ylabel("Count", size=14)
plt.title("Multiple Histograms with Matplotlib")
plt.legend(loc='upper right')
plt.savefig("overlapping_histograms_with_matplotlib_Python.png")
Matplotlib, automatically chooses a color for each variable in the plot.

Overlapping histograms with 3 distributions using matplotlib
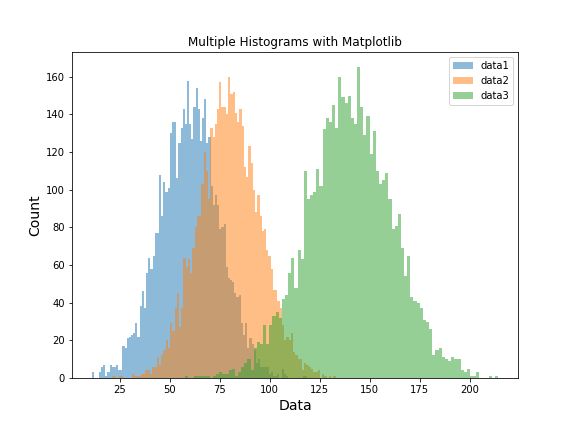
Let us see how can we make a plot with three overlapping histograms using Matplotlib. Here, for the third variable, we use the sum of the two variables we generated. And again, we specify hist() function on each of the three variables to make overlapping histograms.
plt.figure(figsize=(8,6))
plt.hist(data1, bins=100, alpha=0.5, label="data1")
plt.hist(data2, bins=100, alpha=0.5, label="data2")
plt.hist(data1+data2, bins=100, alpha=0.5, label="data3")
plt.xlabel("Data", size=14)
plt.ylabel("Count", size=14)
plt.title("Multiple Histograms with Matplotlib")
plt.legend(loc='upper right')
plt.savefig("overlapping_histograms_with_matplotlib_Python_2.png")
Now we get a nice plot with three overlapping histograms using Matplotlibs as we wanted.


