Last updated on August 17, 2022
In this tutorial, we will learn how to make notched boxplots using ggplot2 in R. Notched boxplot is a variant of boxplot that helps comparing boxplots from different groups in a plot. “Notch” refers to the narrowing of the box around the median of the boxplot.
If we are interested in difference between medians of two boxplots, two boxplot with overlapping notches would suggest that there is no differences between the two groups plotted as boxplots. On the other hand if the notoches between two boxplots do not overlap then we can be confident that their median is significantly different from each other.
Let us get started by loading the packages needed, in this case we load tidyverse suite and plamer penguin dataset.
library(tidyverse)
library(palmerpenguins)
theme_set(theme_bw(16))
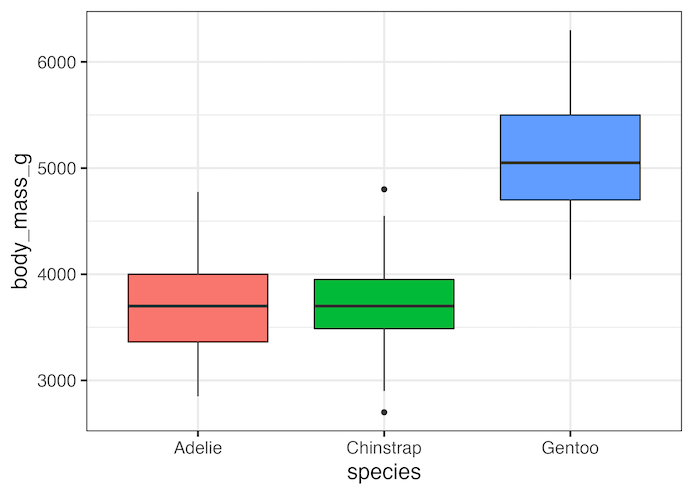
First, let us go ahead and make a simple boxplot using geom_boxplot() showing the body mass across three penguin species.
penguins %>%
  drop_na() %>%
  ggplot(aes(x=species, y=body_mass_g, fill=species))+
  geom_boxplot()+
  theme(legend.position = "none")
ggsave("boxplot_ggplot.png")
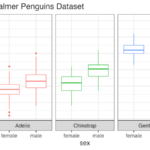
Notched Boxplot in ggplot2
To make a notched boxplot, we need to specify notch=TRUE as argument to geom_boxplot().
penguins %>%
  drop_na() %>%
  ggplot(aes(x=species,y=body_mass_g, fill=species))+
  geom_boxplot(notch=TRUE)+
  theme(legend.position = "none")
ggsave("how_to_make_notched_boxplot_ggplot.png")

In the above notched boxplot we can see that notches for Adelie and Chinstrap overlap suggesting that there is no difference in median values of body mass between them. However, the notch for Gentoo does not overlap with neither of the other two groups suggesting that median body mass of Gentoo is sificantly different from the other two species.
Explore the Complete ggplot2 Guide
35+ tutorials with code: scatterplots, boxplots, themes, annotations, facets, and more—tested and beginner-friendly.
Visit the ggplot2 Hub → No fluff—just code and visuals.