In this post, we will learn how to remove legend of a plot made with ggplot2 in 4 different ways. Adding legend to a plot is often helpful to easily understand a plot. However there are scenarios legends can be redundant or we don’t need them.
In ggplot2, we have multiple options to remove legend in a plot. In this tutorial we will see four ways to remove legend with examples.
Let us load the packages needed.
library(tidyverse)
theme_set(theme_bw(16))
How to remove legend in ggplot2
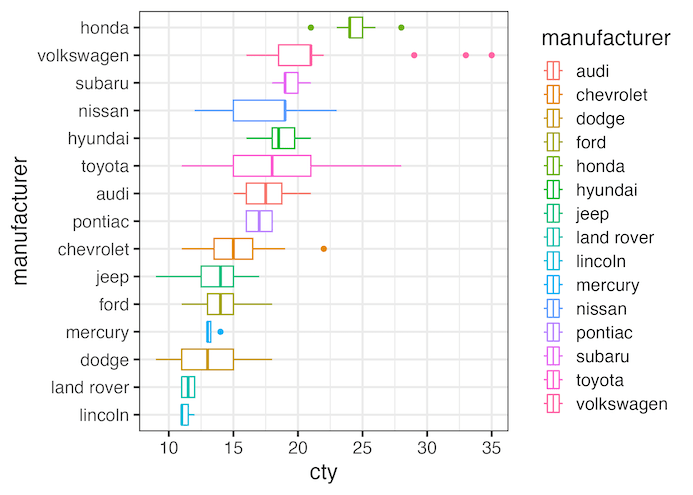
Let us make a plot with ggplot2 with legend added by color argument to aes() in the boxplot below. Note we can also add legend with fill argument to aes() function in the plot belpw.
mpg %>%
  ggplot(aes(y = fct_reorder(manufacturer, cty),
             x = cty,
             color=manufacturer))+
  geom_boxplot()+
  labs(y="manufacturer")
ggsave("how_to_remove_legend_in_ggplot.png")
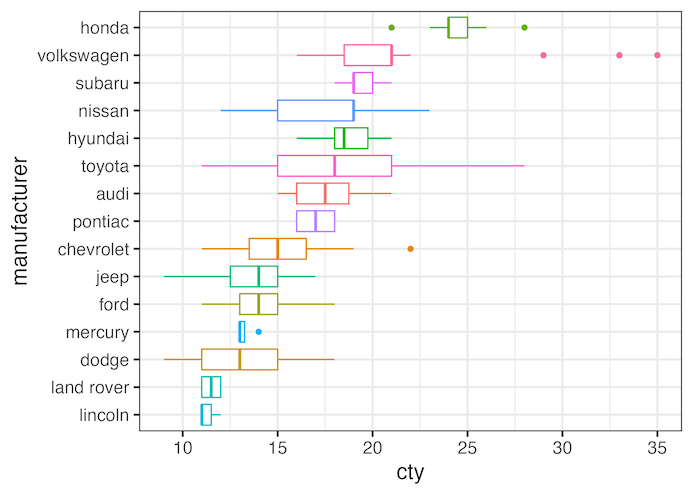
1. Removing legend with theme()
One of the ways to remove legends in a ggplot is to use theme() layer with legend.position=”none’ argument. This will remove all the legends in the plot.
mpg %>%
  ggplot(aes(y = fct_reorder(manufacturer, cty),
             x=cty,
             color=manufacturer))+
  geom_boxplot()+
  labs(y="manufacturer")+
  theme(legend.position="none")
ggsave("remove_legend_in_ggplot_with_theme.png")

2. Removing legend with guides()
mpg %>%
  ggplot(aes(y = fct_reorder(manufacturer, cty),
             x=cty,
             color=manufacturer))+
  geom_boxplot()+
  labs(y="manufacturer")+
  guides(color="none")
ggsave("remove_legend_in_ggplot_with_guides.png")

Removing legend with show.legend=FALSE inside geom_*()
We can also remove legend using show.legend=FALSE within geom_*. In this example we use show.legend=FALSE argument inside geom_boxplot().
mpg %>%
  ggplot(aes(y = fct_reorder(manufacturer, cty),
             x = cty,
             color=manufacturer))+
  geom_boxplot(show.legend=FALSE)+
  labs(y="manufacturer")
ggsave("remove_legend_in_ggplot_with_show_legend.png")
Removing legend with ggeasy’s easy_remove_legend()
Fourth way to remove legend that may be easy to remember is to use ggeasy package and use the function easy_remove_legend().
library(ggeasy)
mpg %>%
  ggplot(aes(y = fct_reorder(manufacturer, cty),
             x=cty,
             color=manufacturer))+
  geom_boxplot()+
  labs(y="manufacturer")+
  easy_remove_legend()
ggsave("remove_legend_in_ggplot_with_ggeasy.png")


