
Adding right set of colors to plot can reveal a pattern that is not seen before. Seaborn Color Palettes makes it really easy to add group of suitable colors to your data visualization. In this post, we will learn how to use Seaborn Color Palettes to color a boxplot made with Seaborn. Although we illustrate the use of color palettes with boxplot, the idea is more general and can be applied to other plots as well.
👉 Want more? Explore the full Seaborn Tutorial Hub with 35+ examples, code recipes, and best practices.
Let us load the packages we need to color boxplots using different color palettes available in Seaborn/Python.
import seaborn as sns
import matplotlib.pyplot as plt
import pandas as pd
import numpy as np
Create Dataset for Boxplots
We will create a dataset to make boxplot using NumPy’s random module. Here we are creating four variables of interest.
n = 100
Africa= np.random.normal(40, 15, n)
Asia=np.random.normal(55, 10,n)
N_America= np.random.normal(80, 5, n)
S_America= np.random.normal(65, 9, n)
Then we store the four variables in in tidy long form.
lifeExp=np.concatenate([Africa,Asia,N_America, S_America])
continent= ["Africa"]* n + ["Asia"]* n +["N_America"]* n + ["S_America"]* n
Our dataframe contain two columns/variables.
df = pd.DataFrame({'continent':continent,
                  'lifeExp':lifeExp})
df.head()

continent	lifeExp
0	Africa	54.970152
1	Africa	-3.443831
2	Africa	71.325621
3	Africa	37.906156
4	Africa	56.622742
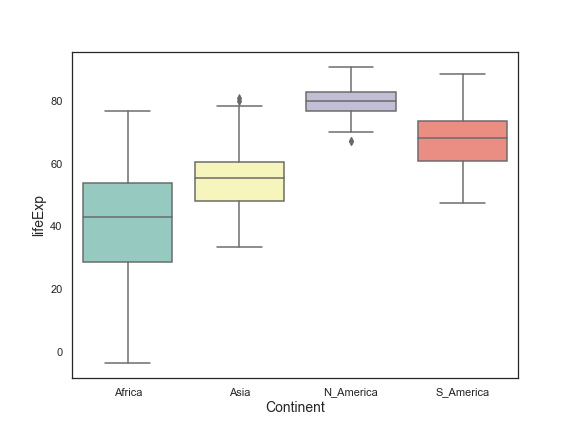
How to Make a Simple Boxplot in Python
Now, we are ready to make boxplot. Let us make a simple boxplot using Seaborn. We use Seaborn’s boxplot() function to make the boxplot and set axis labels.
plt.figure(figsize=(8,6))
sns.set_style("white")
sns.boxplot(x="continent",
            y="lifeExp",
            data=df)
plt.xlabel("Continent",
            size=14)
plt.ylabel("lifeExp",
           size=14)
plt.savefig("boxplot_with_default_colors_Seaborn_Python.png")
We have four boxes corresponding to four categorical values for the x-axis variable. We can see that Seborn has colored our boxplots by default.

How to Use Color Palette in Seaborn boxplot()
Seaborn boxplot() function to make boxplots has palette argument. In this example below, we have set palette=”Set3″ and it uses a qualitative color palette Set3 to color the boxes in boxpolot.
plt.figure(figsize=(8,6))
# set Boxplot color with color palette "Set3"
sns.boxplot(x="continent",
            y="lifeExp",
            data=df,
            palette="Set3")
plt.xlabel("Continent", size=14)
plt.ylabel("lifeExp", size=14)
plt.savefig("boxplot_with_palette_Set3_Seaborn_Python.png")
Here is example using the palette “Set1” to color the boxplots.
plt.figure(figsize=(8,6))
# set Boxplot colors with color palette "Set1"
sns.boxplot(x="continent",
            y="lifeExp",
            data=df,
            palette="Set1")
plt.xlabel("Continent", size=14)
plt.ylabel("lifeExp", size=14)
plt.savefig("boxplot_color_palette_Set1_Seaborn_Python.png")

How to Manually Create a Color Palette in Python with Seaborn
We can also manually specify colors and create a color palette with Seaborn. We first specify the color codes in a list and then use Seaborn’s color_palette() function to create a color palette using the specified colors. We can then use the color palette using set_palette() function.
plt.figure(figsize=(8,6))
# set Boxplot color with manual colors
flatui = ["#9b59b6", "#3498db", "#95a5a6", "#e74c3c", "#34495e", "#2ecc71"]
sns.set_palette(sns.color_palette(flatui))
sns.boxplot(x="continent",
           y="lifeExp",
           data=df)
plt.xlabel("Continent", size=14)
plt.ylabel("lifeExp", size=14)
plt.savefig("boxplot_color_palette_manual_Seaborn_Python.png")
The set_palette() function in Seaborn is extremely handy as it is not specific for Seaborn’s boxplot(). We can use it for visualization with Seaborn.


