Last updated on September 28, 2021
A well made table showing the summary of the data is under utilized. gt() package available as part of tidyverse improves the look of a table and makes it easy to read and understand.
If you think gt is cool, wait until you see the work of Thomas Mock. Thomas Mock has created the fantastic R package gtExtras, that takes your tables to next level :). Just came across a Thomas Mock’s tweet on making a beautiful table with just a five lines R code.
Here is working through his code using tidytuesday dataset on Emmy Awards and Nominees. We will use the summarized version of the data to visualize the producers and their Win/nomination of Emmy awards.
library(tidyverse)
library(palmerpenguins)
theme_set(theme_bw(16))
Let us use the summarized data from Emmy awards to make a table.
p2data <- "https://raw.githubusercontent.com/datavizpyr/data/master/Emmy_awards_summary_tidytuesday.tsv"
stream_data <- read_tsv(p2data)
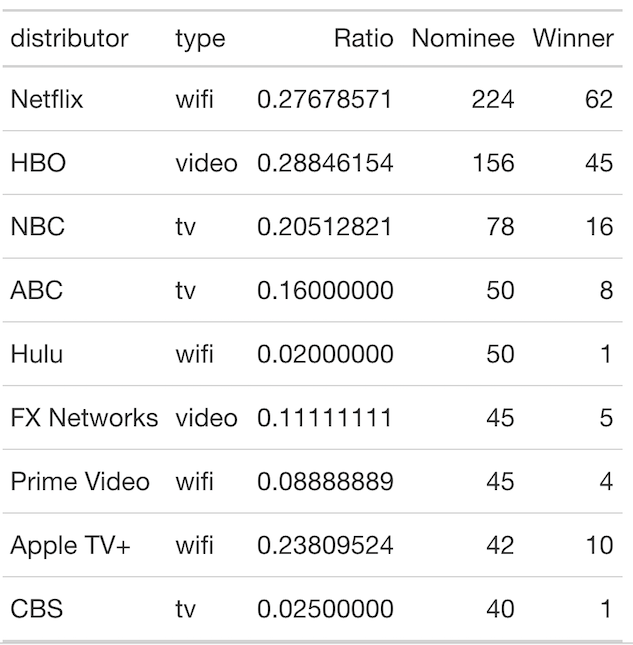
stream_data

## # A tibble: 9 × 5
##   distributor type   Ratio Nominee Winner
##   <chr>       <chr>  <dbl>   <dbl>  <dbl>
## 1 Netflix     wifi  0.277      224     62
## 2 HBO         video 0.288      156     45
## 3 NBC         tv    0.205       78     16
## 4 ABC         tv    0.16        50      8
## 5 Hulu        wifi  0.02        50      1
## 6 FX Networks video 0.111       45      5
## 7 Prime Video wifi  0.0889      45      4
## 8 Apple TV+   wifi  0.238       42     10
## 9 CBS         tv    0.025       40      1
stream_data %>%
  gt()
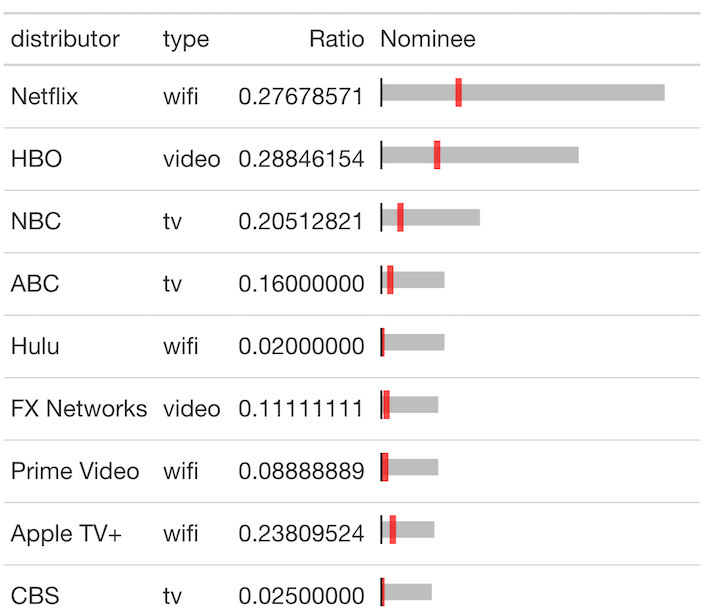
We can use gtExtras’ function to add a plot showing the numbers in a column in the table.
stream_data %>%
  gt() %>%
  gt_plt_bullet(column = Nominee, target = Winner)
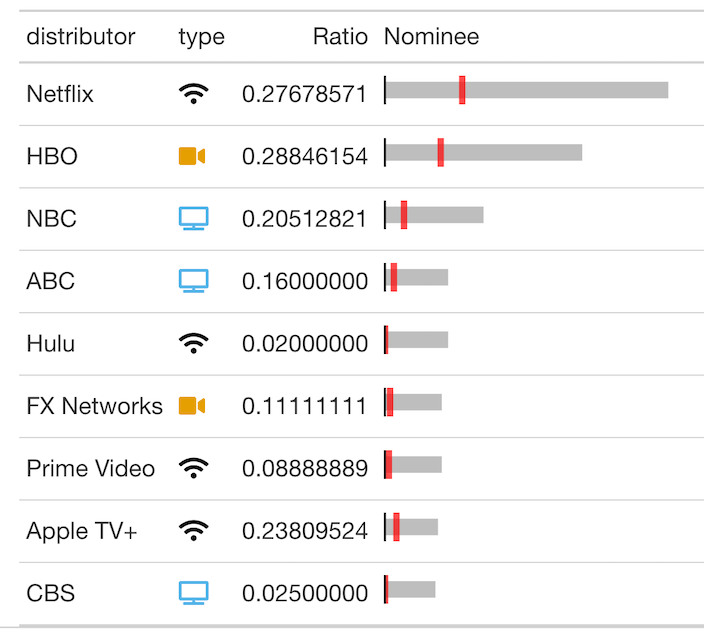
Let us add company icon image in the table for company names.
stream_data %>%
  gt() %>%
  gt_plt_bullet(column = Nominee, target = Winner) %>%
  gt_fa_column(column = type)
Let us use NYTimes themes to the table.
stream_data %>%
  gt() %>%
  gt_plt_bullet(column = Nominee, target = Winner) %>%
  gt_fa_column(column = type) %>%
  gt_theme_nytimes()
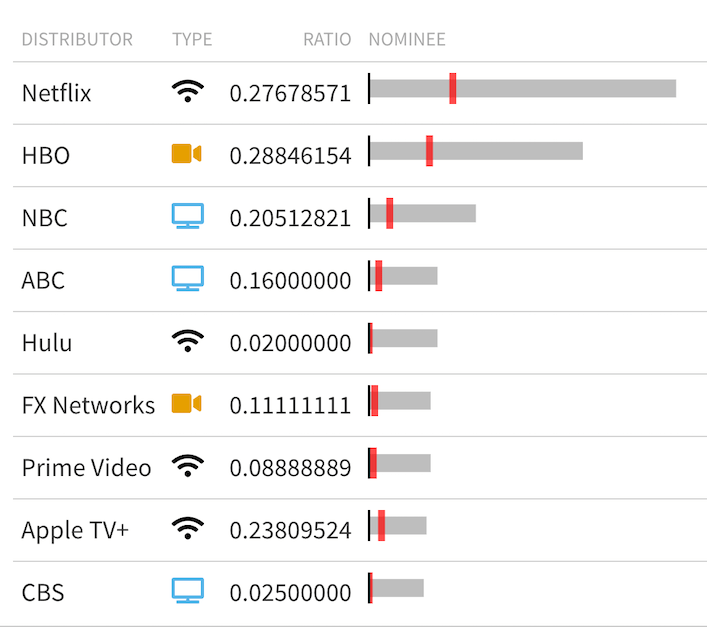
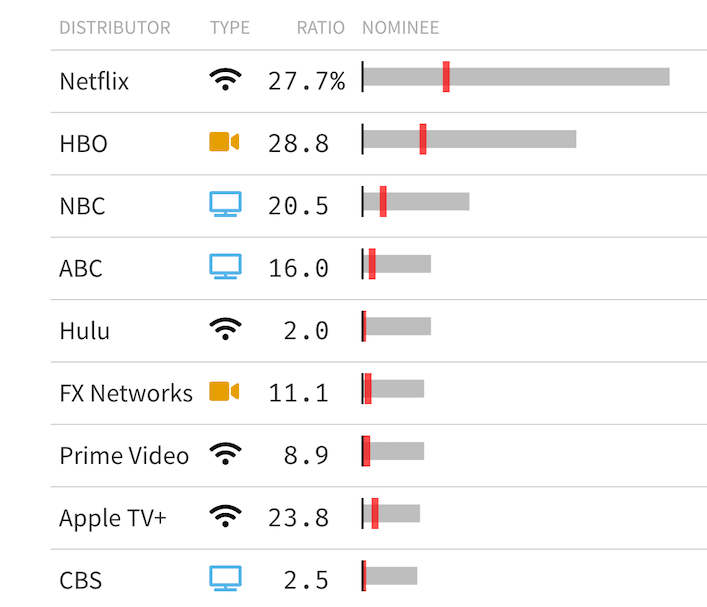
Here we format the digits.
stream_data %>%
  gt() %>%
  gt_plt_bullet(column = Nominee, target = Winner) %>%
  gt_fa_column(column = type) %>%
  gt_theme_nytimes() %>%
  fmt_symbol_first(column = Ratio, suffix = "%",
                   decimals = 1, scale_by = 100)