When you make data visualization one might want to highlight a specific region of the plot by adding some annotation. In this post, we will learn how to add rectangle on top of a plot made with matplotlib in Python. We will first add a simple rectangle with specific color and then learn how to fill the rectangle with a color of choice. Next we will also see an example of adding text to describe the addition of rectangle. And finally we will see how can we add multiple rectangles on matplotlib plot in python.
Let us load Matplotlib and Pandas.
import matplotlib.pyplot as plt
import pandas as pd
We will use Palmer penguins dataset and load it directly from datavizpyr.com’s github page.
penguins_data="https://raw.githubusercontent.com/datavizpyr/data/master/palmer_penguin_species.tsv"
# load penguns data with Pandas read_csv
df = pd.read_csv(penguins_data, sep="\t")
df.head()
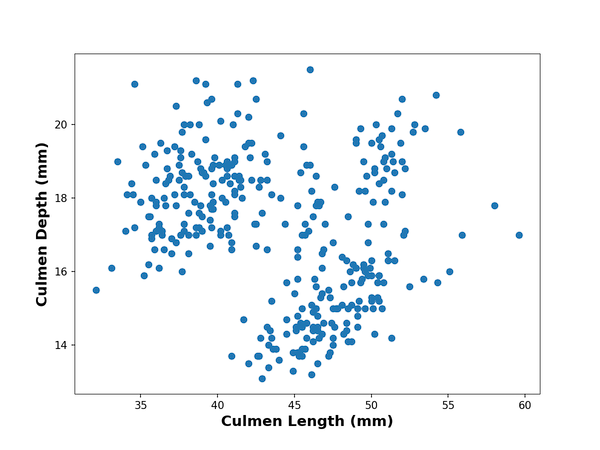
To illustrate how to add rectangle on a plot made with matplotlib, we will use scatter plot made with matplotlib. Let us first make the scatter plot using scatter() function in matplotlib. Here we also specify x and y-axis labels in bold font with larger fontsize.
plt.scatter(x=df.culmen_length_mm,
            y=df.culmen_depth_mm)
plt.xlabel("Culmen Length (mm)",fontweight ='bold', size=14)
plt.ylabel("Culmen Depth (mm)", fontweight ='bold',size=14)

How To Draw Rectangle on a Plot Made With matplotlib?
patches module in matplotlib allows us add shapes like rectangle on top of a plot. Let us load patches as mpatches.
import matplotlib.patches as mpatches
We can add rectangle by using Rectangle() function in patches module. The Rectangle function takes the location/size of the rectangle you need, left position, bottom location, and width & height.
# specify the location of (left,bottom),width,height
rect=mpatches.Rectangle((31,15),14,7,
                        fill = False,
                        color = "purple",
                        linewidth = 2)
To add this rectangle object on top of the already exisitng plot, we get current axis using gca() function and add the rectangle on top of the plot using add_patch() function.
plt.gca().add_patch(rect)
We just saw how to add rectangle step-by-step above. Let us put together the codes above as chunk and add rectangle on top of the scatter plot.
plt.scatter(x=df.culmen_length_mm,
            y=df.culmen_depth_mm)
plt.xlabel("Culmen Length (mm)",fontweight ='bold', size=14)
plt.ylabel("Culmen Depth (mm)", fontweight ='bold',size=14)
left, bottom, width, height = (31, 15, 14, 7)
rect=mpatches.Rectangle((left,bottom),width,height,
                        fill=False,
                        color="purple",
                       linewidth=2)
                       #facecolor="red")
plt.gca().add_patch(rect)
And we get a nice scatter plot with rectangle highlighting the specific portion of the plot as we needed.

How To Draw Rectangle filled with color on a Plot Made With matplotlib?
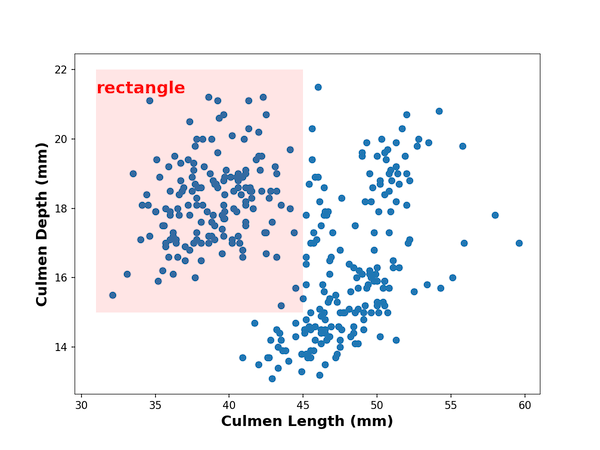
Previously, we drew a simple rectangle.Now, let us customize it in a few different ways. First, we will fill the rectangle with a color to highlight the portion of the plot better.
We can fill the rectangle with a color by not using fill=False and specifying the color with facecolor. Here we also specify transparency level for filling.
plt.scatter(x=df.culmen_length_mm,
            y=df.culmen_depth_mm)
plt.xlabel("Culmen Length (mm)",fontweight ='bold', size=14)
plt.ylabel("Culmen Depth (mm)", fontweight ='bold',size=14)
left, bottom, width, height = (31, 15, 14, 7)
rect=mpatches.Rectangle((left,bottom),width,height,
                        #fill=False,
                        alpha=0.1,
                       facecolor="red")
plt.gca().add_patch(rect)

How To Add Text Annotation to Rectangle on a Plot Made With matplotlib?
We can add text to describe the rectangle using text() function in matplotlib. Here, we add text annotation right after we draw rectangle.
plt.scatter(x=df.culmen_length_mm,
            y=df.culmen_depth_mm)
plt.xlabel("Culmen Length (mm)",fontweight ='bold', size=14)
plt.ylabel("Culmen Depth (mm)", fontweight ='bold',size=14)
left, bottom, width, height = (31, 15, 14, 7)
rect=mpatches.Rectangle((left,bottom),width,height,
                        #fill=False,
                        alpha=0.1,
                        #color="purple",
                       #linewidth=2,
                       facecolor="red")
plt.gca().add_patch(rect)
# add text with text() function in matplotlib
plt.text(31, 21.3,'rectangle',fontsize=16, color="red", weight="bold")

How To Draw Multiple Rectangles on a Plot Made With matplotlib?
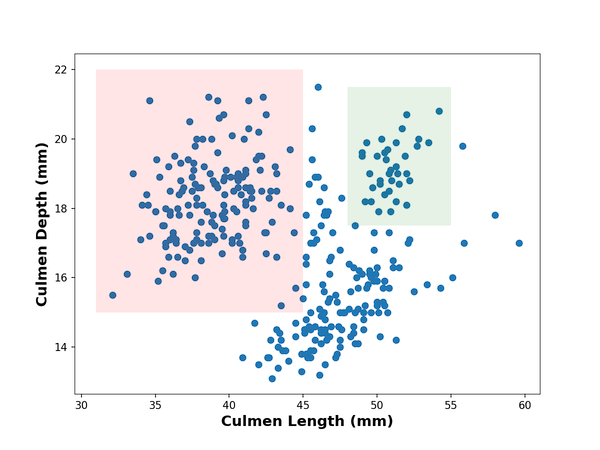
It is also easy to add multiple rectangles to highlight multiple parts of the plot. In this example, we use the similar code chunk twice to add two rectangles in different colors.
# make scatter plot
plt.scatter(x=df.culmen_length_mm,
            y=df.culmen_depth_mm)
plt.xlabel("Culmen Length (mm)",fontweight ='bold', size=14)
plt.ylabel("Culmen Depth (mm)", fontweight ='bold',size=14)
# add first rectangle with patches
left, bottom, width, height = (31, 15, 14, 7)
rect=mpatches.Rectangle((left,bottom),width,height,
                        #fill=False,
                        alpha=0.1,
                        #color="purple",
                       #linewidth=2,
                       facecolor="red")
plt.gca().add_patch(rect)

# add second rectangle with patches
left, bottom, width, height = (48, 17.5, 7, 4)
rect=mpatches.Rectangle((left,bottom),width,height,
                        #fill=False,
                        alpha=0.1,
                        #color="purple",
                       #linewidth=2,
                       facecolor="green")
plt.gca().add_patch(rect)
And this is how the plot with two filled rectangles over a scatter plot looks like.


