Last updated on May 20, 2021
In this post we will learn examples of adding text, annotating bars in barplot using matplotlib. We will make bar plots using Seaborn’s barplot and use Matplotlib to add annotations to the bars in barplot.
Let us load Pandas, Seaborn and Matplotlib.
import pandas as pd
import seaborn as sns
import matplotlib.pyplot as plt
Let us create a toy dataset using two lists.
continent = ["Africa","Americas","Asia","Europe","Oceania"]
lifeExp=[49,65,60,72,74]
And create a Pandas dataframe from the two lists.
df = pd.DataFrame({"continent":continent, "lifeExp":lifeExp})
df

      continent	lifeExp
0	Africa	49
1	Americas	65
2	Asia	60
3	Europe	72
4	Oceania	74
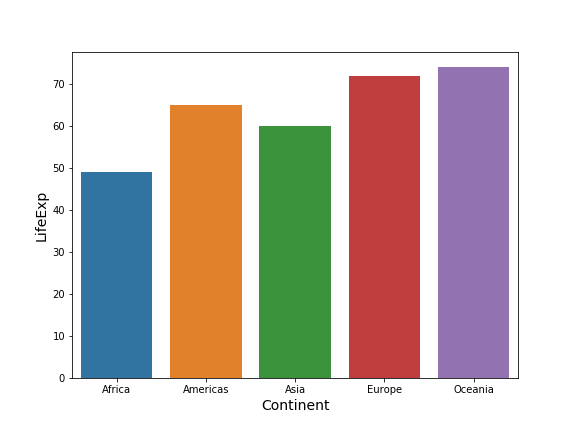
We have the data ready to make a barplot and annotate the bars. Let us start with making a simple barplot using Seaborn’s barplot() function.
plt.figure(figsize=(8, 6))
sns.barplot(x="continent",y="lifeExp",data=df)
plt.xlabel("Continent", size=14)
plt.ylabel("LifeExp", size=14)
plt.savefig("bar_plot_Seaborn_Python.png")
The barplot shows average life expectancy values as bar for each continent from gapminder dataset.
Adding Annotation to Barplots with annotate() function in Matplotlib
Sometimes, it may be useful to add the actual values of bar height on each bar in a barplot. To annotate bars in barplot made with Seaborn, we will use Matplotlib’s annotate function. Matplotlib’s annotate() function is pretty versatile and we can customize various aspects of annotation in a plot.
In the code below, we loop through each bar in the Seaborn barplot object and use annotate() function to get the height of the bar, decide the location to annotate using barwidth, height and its coordinates. We can also control the size the text on top of each bar.
plt.figure(figsize=(8, 6))
splot=sns.barplot(x="continent",y="lifeExp",data=df)
for p in splot.patches:
    splot.annotate(format(p.get_height(), '.1f'),
                   (p.get_x() + p.get_width() / 2., p.get_height()),
                   ha = 'center', va = 'center',
                   xytext = (0, 9),
                   textcoords = 'offset points')
plt.xlabel("Continent", size=14)
plt.ylabel("LifeExp", size=14)
plt.savefig("add_text_to_top_of_bars_in_barplot_Seaborn_Python.png")
Now we get barplot with annotations on each bar showing the heights of the bar. With the argument xytext, we have annotation on top of the bars.

We can customize annotation a bit. Sometimes adding annotation over the bar can overlap with the plot outline. A solution is to add the annotation inside the bars of barplot. Here we changed the position using xytext.
plt.figure(figsize=(8, 6))
splot=sns.barplot(x="continent",y="lifeExp",data=df)
for p in splot.patches:
    splot.annotate(format(p.get_height(), '.1f'),
                   (p.get_x() + p.get_width() / 2., p.get_height()),
                   ha = 'center', va = 'center',
                   size=15,
                   xytext = (0, -12),
                   textcoords = 'offset points')
plt.xlabel("Continent", size=14)
plt.ylabel("LifeExp", size=14)
plt.savefig("add_annotation_to_bars_in_barplot_Seaborn_Python.png")
We get a barplot with annotation inside the bars. In the example here we have also increased the font size of the annotation with size argument.

Annotating barplots with Matplotlib’s bar_label()
Starting from Matplotlib version 3.4.2 and above, Matplotlib has added a new function, bar_label(), to annotate barplots easily. Check out the following post to learn how to use Matplotlib’s bar_label() function to add annotations.


