Last updated on March 5, 2020
In this post, we will learn how to make horizontal stripplot with jitter using Altair in Python. In an earlier post we learned step-by-step instructions to make stripplot with jitter.
import altair as alt
import pandas as pd
#import numpy as np
We will use gapminder dataset to make the stripplot with Altair. Let us load the data from web using Pandas’s read_csv() function.
data_url = 'http://bit.ly/2cLzoxH'
gapminder = pd.read_csv(data_url)
gapminder.head()
	country	year	pop	continent	lifeExp	gdpPercap
0	Afghanistan	1952	8425333.0	Asia	28.801	779.445314
1	Afghanistan	1957	9240934.0	Asia	30.332	820.853030
2	Afghanistan	1962	10267083.0	Asia	31.997	853.100710
3	Afghanistan	1967	11537966.0	Asia	34.020	836.197138
4	Afghanistan	1972	13079460.0	Asia	36.088	739.981106
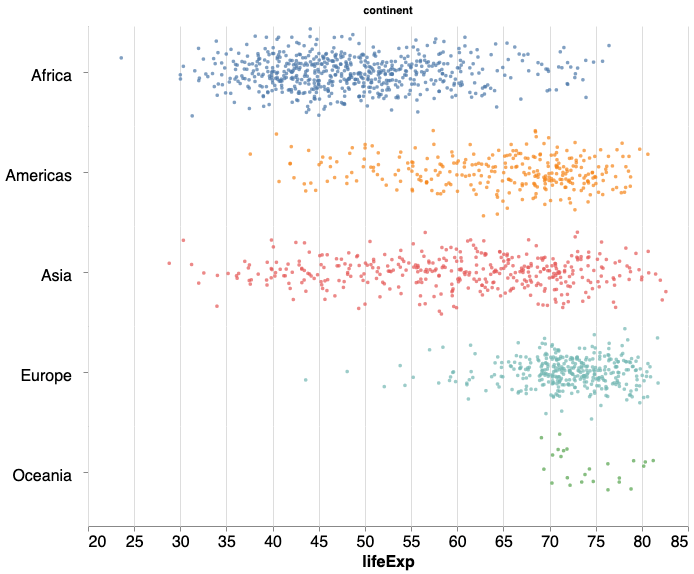
We will primarily follow the code for stripplot with jitter with one big change that is we swap our x and y-axis variables. In the code for horizontal stripplot, our x-axis is lifeExp and y-axis is the jitter.
horizontal_stripplot =  alt.Chart(gapminder, width=600, height=100).mark_circle(size=12).encode(
    y=alt.Y(
        'jitter:Q',
        title=None,
        axis=alt.Axis(values=[0], ticks=True, grid=False, labels=False),
        scale=alt.Scale(),
    ),
    x=alt.X('lifeExp:Q', scale=alt.Scale(domain=(20, 85))),
    color=alt.Color('continent:N', legend=None),
    row=alt.Row(
        'continent:N',
        header=alt.Header(
            labelAngle=0,
            labelFontSize=16,
            titleOrient='top',
            labelOrient='left',
            labelAlign='left',
        ),
    ),
).transform_calculate(
    # Generate Gaussian jitter with a Box-Muller transform
    jitter='sqrt(-2*log(random()))*cos(2*PI*random())'
).configure_facet(
    spacing=0
).configure_view(
    stroke=None
).configure_axis(
    labelFontSize=16,
    titleFontSize=16
)
We can use the Altair plot object to visualize the horizontal strippplot.
horizontal_stripplot
We have a nice horizontal stripplot with jitter as we needed.