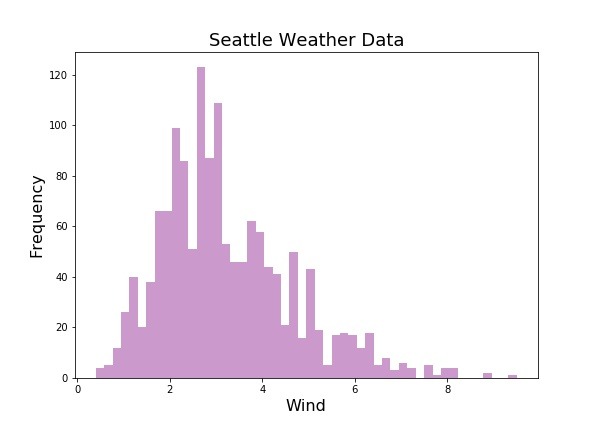
Histograms are a type of barchart, that visualizes how a quantitative variable is distributed. With the right histogram we can quickly learn about the variable. For example, we can learn what is the most common value, what is the minimum and maximum and what is the spread of the variable by looking at the histogram.
In this post, we will see how to make histograms using Seaborn in Python. We will start with the basic histogram with Seaborn and then customize the histogram to make it better.
Let us first load the packages needed
import seaborn as sns
import matplotlib.pyplot as plt
import pandas as pd
import numpy as np
We will use Seattle weather data from vega_datasets() to make histograms with Seaborn.
from vega_datasets import data
seattle_weather = data.seattle_weather()
print(seattle_weather.head(n=3))
How to Make a Basic Histogram with Seaborn?
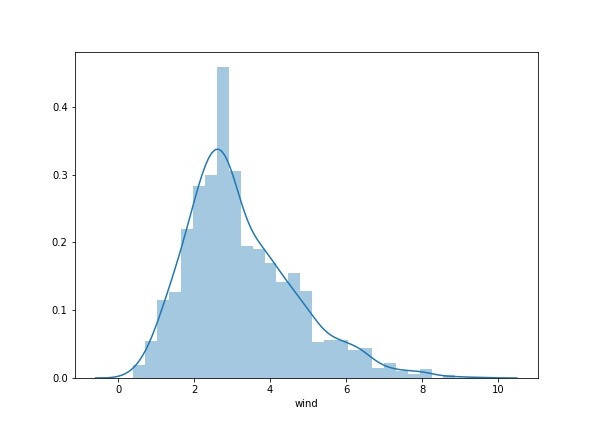
distplot() function in Seaborn help us to make histogram. To make a basic histogram we provide the variable we want to make a histogram as argument to the distplot() function.
In this example, we are plotting the distribution of wind variable from the data.
sns.distplot(seattle_weather['wind'])
The basic histogram we get from Seaborn’s distplot() function looks like this. Be default, Seaborn’s distplot() makes a density histogram with a density curve over the histogram. And it is also a bit sparse with details on the plot.
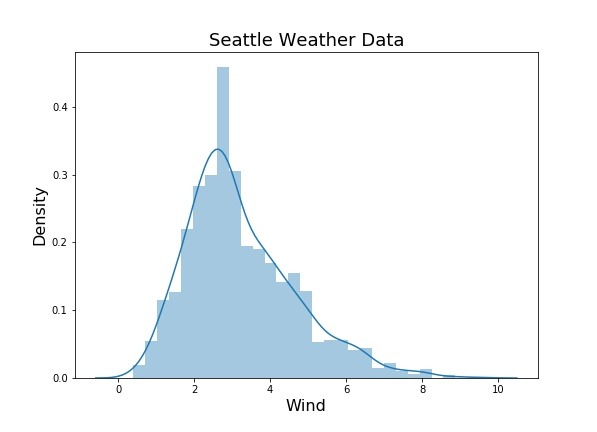
Let us improve the Seaborn’s histogram a bit. Here we change the axes labels and set a title with a larger font size.
sns.distplot(seattle_weather['wind'])
plt.title('Seattle Weather Data', fontsize=18)
plt.xlabel('Wind', fontsize=16)
plt.ylabel('Frequency', fontsize=16)
Now the histogram made by Seaborn looks much better.
How to Change the number of bins in a histogram with Seaborn?
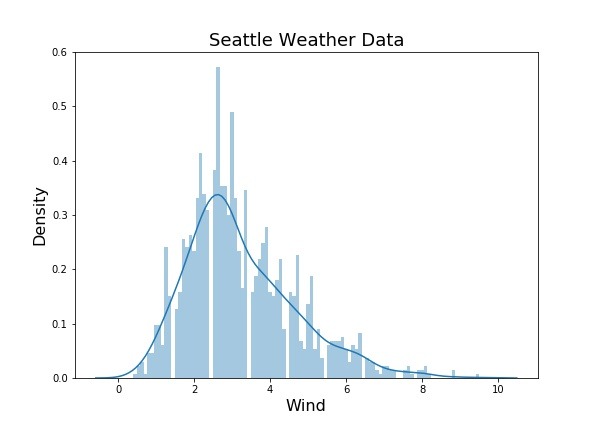
Setting the right number of bins is an important aspect of making a histogram. The shape of a histogram with a smaller number of bins would hide the pattern in a histogram. Similarly a histogram with a larger number of bins would show random variations.
We can set the number of bins in a histogram we make with Seaborn using the bins argument to distplot() function.
sns.distplot(seattle_weather['wind'], bins=100)
plt.title('Seattle Weather Data', fontsize=18)
plt.xlabel('Wind', fontsize=16)
plt.ylabel('Frequency', fontsize=16)
In this example, we have set the number of bins to 100 to make histogram with Seaborn’s distplot(). We can clearly see the differences in the shape of histogram between the Seaborn’s default number of bins and 100 bins.
How to Make Frequency Histogram with Seaborn?
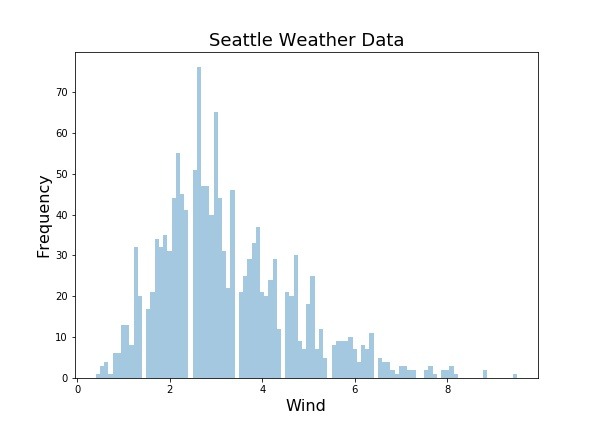
Frequency histograms are often useful as it reveals the acutal number of data points in a bin directly from histogram.
We can make a frequency histogram with Seaborn distplot() using the argument kde=False.
sns.distplot(seattle_weather['wind'], kde=False, bins=100)
plt.title('Seattle Weather Data', fontsize=18)
plt.xlabel('Wind', fontsize=16)
plt.ylabel('Frequency', fontsize=16)
Now the histogram from distplot() is a frequency histogram. Check the y-axis, now we have counts instead of density as fractions. And also a frequency histogram will not have the density curve or density line over the histogram.
How to Change Histogram Color in Seaborn?
By dfault, Seaborn’s distplot() makes the histogram filling the bars in blue. We can manually change the histogram color using the color argument inside distplot() function.
sns.distplot(seattle_weather['wind'], kde=False, color="purple", bins=50)
plt.title('Seattle Weather Data', fontsize=18)
plt.xlabel('Wind', fontsize=16)
plt.ylabel('Density', fontsize=16)
In this example, we have used the argument color=”purple” to make purple histogram as shown below.
