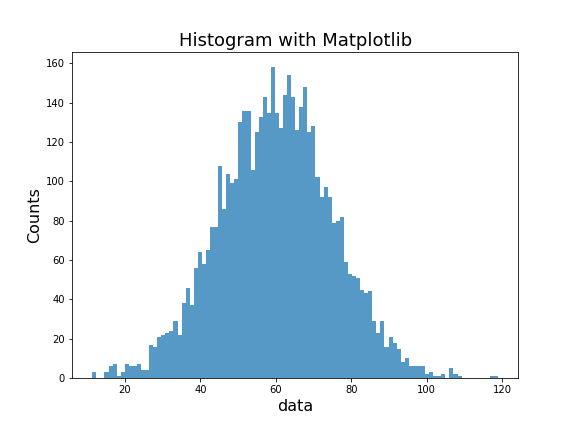
In this post, we will see an example of how to make histogram with Matplotlib library in Python. Matplotlib’s pyplot module is designed to make a number of types of plots with Matplotlib. We will use pyplot module’s function hist() to make histograms with matplotlib.
Let us load Matplotlib.pyplot and Numpy library.
import matplotlib.pyplot as plt
import numpy as np
We will generate data to make a histogram using NumPy’s random module. Here were using NumPy.random’s normal distribution function to generate random numbers for our data.
# set seed for reproducing
np.random.seed(42)
# specify mean
mean_mu = 60
specify Standard deviation
sd_sigma = 15
# number of data points
n = 5000
# generate random numbers from normal distribution
data = np.random.normal(mean_mu, sd_sigma, n)
Matplotlib’ Pyplot has hist() function that takes the data as input and makes histogram. In addition to data, hist() function can take a number of arguments to customize the histogram.
Here we specify the number of bins with “bins=100″ argument and specify we want frequency histogram with ” density=False” argument. We also specify transparency levels for the fill color with alpha=0.75.
# the histogram of the data
n, bins, patches = plt.hist(data, bins=100, density=False, alpha=0.75)
plt.xlabel('data',size=16)
plt.ylabel('Counts',size=16)
plt.title('Histogram with Matplotlib',size=18)
pyplot’s hist function also returns three tuples with all the information needed for histogram. And be default, pyplot’s hist() function colors the histogram in blue as shown below.


