In this post we will learn how to make a histogram with a median line using Altair in Python. This is also a great example illustrating the power of Altair’s grammar of graphics.
Let us load the packages needed to make histogram with a median or mean line using Altair.
import altair as alt
import numpy as np
import pandas as pd
Let us generate data to make a histogram with a median line. We will use Numpy to generate random numbers from normal distribution and store in a Pandas dataframe.
# Generating Data
np.random.seed(42)
df = pd.DataFrame({
    'height': np.random.normal(150, 10, 1000)
})
The basic idea behind making a histogram with a median line is that we create two layers of Altair image object and then combine them.
We first create a base plot using Altair’s chart function with the dataframe containing the data.
base = alt.Chart(df)
Then we use the base object to make histogram using Altair’s mark_bar() function. Here we specify, which variable we are interested in to make histogram.
hist = base.mark_bar().encode(
    x=alt.X('height:Q', bin=alt.BinParams(), axis=None),
    y='count()'
)
Then we use the base object with the data again to create median line using mark_rule() function in Altair.
median_line = base.mark_rule().encode(
    x=alt.X('mean(height):Q', title='Height'),
    size=alt.value(5)
)
To make the basic histogram with median line we simply combine the histogram object and the median line object as follows.
hist + median_line

Now we have our basic histogram with median line as wanted using Altair.
Customizing Histogram with Median Line using Altair
Note that in the basic histogram with median line, Altair has chosen a number of parameters describing the histogram by default. For example, Altair has chosen blue color for histogram and number of bins for us. Similarly, Altair has chosen black color for the median line.
One way to improve the plot is to customize the histogram with median line using Altair.
First, let us increase the number of bins in the histogram. Then next change the color of the median line to red.
To make histogram with 100 bins, we first create Altair histogram object with 100 bins using `maxbins=100` argument inside x axis properties.
hist2 = base.mark_bar().encode(
    x=alt.X('height:Q', bin=alt.BinParams(maxbins=100), axis=None),
    y='count()'
)
We can change the color of median line to red using `color=red` inside mark_rule() function.
red_median_line = base.mark_rule(color='red').encode(
    x=alt.X('mean(height):Q', title='Height'),
    size=alt.value(5)
)
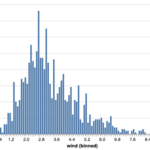
Let us combine both the histogram and median line objects. And we will have the improved version of histogram with median line in Altair.
hist2 + red_median_line
Now we the histogram with 100 bins and red median line using Altair in Python.