When you have a multiple groups and subgroups within each groups with associated numerical values, we can use Grouped boxplots to visualize. With Seaborn we can make grouped boxplots using boxplot() function and much newer function Catplot(). Seaborn Catplot is a function that unifies multiple data visualization techniques, including boxplots, when you have a numerical variable and one or more categorical variables.
Let us import Seaborn, Pandas and Matplotlib to make grouped boxplot using Catplot.
1 2 3 | import seaborn as sns import matplotlib.pyplot as pltimport pandas as pd |
We will make grouped boxplot using stocks dataset available from vega_datasets. The stocks data contains stock prices for the top tech companies: IBM,Apple, Microsoft, Google, and Amazon for years 2000 to 2010.
1 2 3 4 5 6 7 8 9 10 | from vega_datasets import datastocks = data.stocks()stocks.head() symbol date price0 MSFT 2000-01-01 39.811 MSFT 2000-02-01 36.352 MSFT 2000-03-01 43.223 MSFT 2000-04-01 28.374 MSFT 2000-05-01 25.45 |
Let us create year variable from the date column. In Pandas we can first convert the date column to DatatimeIndex variable and then use year accessor to get the year from date variable We will use the year variable in our grouped boxplots with Catplot.
1 2 3 4 5 6 7 8 9 | stocks['year']=pd.DatetimeIndex(stocks['date']).yearstocks.head()symbol date price year0 MSFT 2000-01-01 39.81 20001 MSFT 2000-02-01 36.35 20002 MSFT 2000-03-01 43.22 20003 MSFT 2000-04-01 28.37 20004 MSFT 2000-05-01 25.45 2000 |
Just for the sake of simplicity, we will filter the stocks data to contain stock prices for the year 2007, 2008 and 2009.
1 | stocks_df = stocks.query('year>=2007 & year<=2009') |
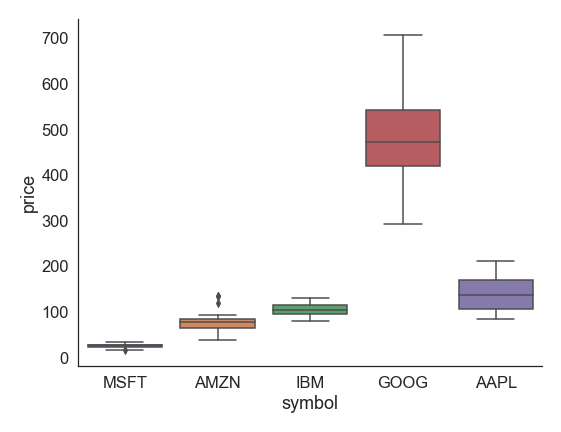
Let use first start with making a simple boxplot using Catplot in Seaborn. To make boxplot with Seaborn’s Catplot, we need to use kind=”boxplot” argument,
1 2 3 | sns.catplot(x='symbol', y='price', data=stocks_df, kind="box", height=6, aspect=1.3); |
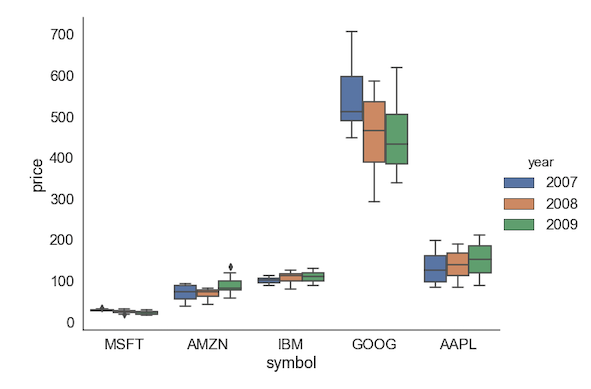
Grouped Boxplot with Seaborn Catplot
We have a simple data set with one numerical variable; stock price, and two categorical variables tech company and year to make grouped boxplot using Seaborn’s Catplot.
To make grouped boxplot using Catplot, we need to provide which variables should be on x and y first. The variable on x-axis is a categorical variable and variable on y is a numerical variable. We need to specify kind=”boxplot” to tell Catplot that we need to make boxplots. In addition to x and y-axis variable, we need to specify the parameter hue with the second categorical variable. Seaborn’s catplot will use the hue variable to split the boxplot for each group on x-axis and make grouped boxplots.
1 2 3 4 5 6 7 | sns.set(font_scale = 1.5)sns.set_style("white")sns.catplot(x='symbol', y='price', hue="year", data=stocks_df, kind="box", height=6, aspect=1.3);plt.savefig("grouped_boxplot_Seaborn_Catplot_Python.png") |
Customizing Grouped Boxplot with Seaborn Catplot
In this example for making grouped boxplot, we have customized the grouped boxplot in a few ways. We first set font size with Seaborn’s set() function and set style using Seaborn’s set_style() function. In addition to save the grouped boxplot as png file, we have also specified the size of the plot using height and aspect arguments inside catplot().