Last updated on August 17, 2022
In this post we will learn how to fix one of the most common ggplot2 errors, saying “could not find function “ggplot””
Let us consider an example where we are trying to make boxplot using iris, one of the R built-in datasets.
iris %>% head()

##   Sepal.Length Sepal.Width Petal.Length Petal.Width Species
## 1          5.1         3.5          1.4         0.2  setosa
## 2          4.9         3.0          1.4         0.2  setosa
## 3          4.7         3.2          1.3         0.2  setosa
## 4          4.6         3.1          1.5         0.2  setosa
## 5          5.0         3.6          1.4         0.2  setosa
## 6          5.4         3.9          1.7         0.4  setosa
We have been extra careful and write a perfect R code as show below to make a boxplot using ggplot2.
iris %>%
  ggplot(aes(x= Species, y= Sepal.Length, fill=Species))+
  geom_boxplot()+
  theme_bw(16)+
  theme(legend.position = "none")
Then we get the following useful error messsage.
Error in ggplot(., aes(x = Species, y = Sepal.Length, fill = Species)) :
  could not find function "ggplot"
This ggplot2 error is telling us that it could not find the function ggplot() to make the plot that we desired. One of the reasons is that we have installed ggplot2, but forgot to load the library to put to use.
The solution to this “could not find function “ggplot”” error is to load the package using library() function as shown below.
library("ggplot2")
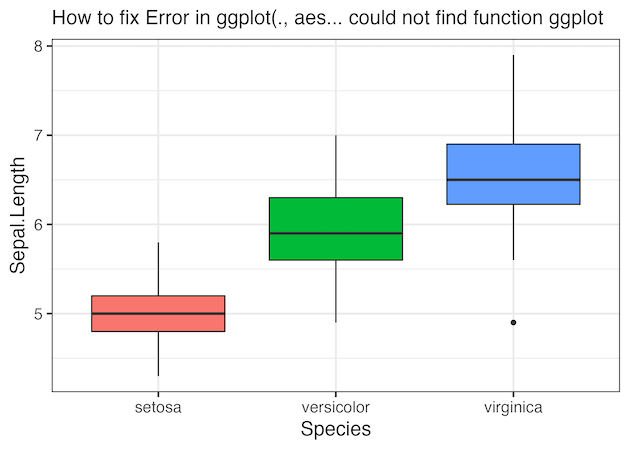
And now if we try to make the plot,
iris %>%
  ggplot(aes(x= Species, y= Sepal.Length, fill=Species))+
  geom_boxplot()+
  theme_bw(16)+
  theme(legend.position = "none")+
  labs(subtitle= "How to fix Error in ggplot(., aes... could not find function ggplot")
ggsave("how_to_fix_could_not_find_function_ggplot.png")
We will get the beautiful boxplot as we wanted.
Another solution is to load the full suite of tidyverse packages including ggplot2 by using library(“tidyverse”) as shown below.
library(tidyverse)
iris %>%
  ggplot(aes(x= Species, y= Sepal.Length, fill=Species))+
  geom_boxplot()+
  theme_bw(16)+
  theme(legend.position = "none")+
  labs(subtitle= "How to fix Error in ggplot(., aes... could not find function ggplot")
ggsave("how_to_fix_could_not_find_function_ggplot.png")
Explore the Complete ggplot2 Guide
35+ tutorials with code: scatterplots, boxplots, themes, annotations, facets, and more—tested and beginner-friendly.
Visit the ggplot2 Hub → No fluff—just code and visuals.