In this post we will learn under what circumstances we will see a ggplot2 error that says something like “replacement has 9 rows, data has 8” in addition to other text that is not easily understood.
We will also see an easy fix to such a difficult sounding error.
library(tidyverse)
theme_set(theme_bw(16)
Let us say we are trying to make scatter plot with ggplot2. And we clearly specify which variable should on x-axis and which variable should be on y-axis and try to make a plot with the following code
mtcars %>%
  ggplot(x=mpg, y=disp)+
  geom_point()
To your horror, you will see the following error. For a second you might think there is some problem with your dataframe or somethings.
Error in `$<-.data.frame`(`*tmp*`, "call_text", value = c("base (local) `<fn>`(x)", :
replacement has 9 rows, data has 8
However, the cause for the error is the missing aes() function before actually defining the aesthetics for the plot.
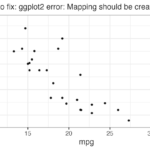
With the right shown below
mtcars %>%
  ggplot(aes(x= mpg, y=disp))+
  geom_point()+
  labs(subtitle= "How to fix `Error in `$<-.data.frame`(`*tmp*`, call_text`)")
ggsave("how_to_fix_error_in_data_frame_tmp_call_text.png")
We will get the scatter plot as expected.

Note that the solution to this ggplot2 error is missing aes() as before. However the cause is clearly different, in this case the presence of x/y variable without aes().
Explore the Complete ggplot2 Guide
35+ tutorials with code: scatterplots, boxplots, themes, annotations, facets, and more—tested and beginner-friendly.
Visit the ggplot2 Hub → No fluff—just code and visuals.