In this post, we will learn how to fix one of the common ggplot2 error messages. While trying to make a ggplot2, we might get the following error.
Error in `+.gg`:
! Cannot use `+.gg()` with a single argument.
Did you accidentally put + on a new line?
The error message here ” Did you accidentally put + on a new line?” is bit helpful as it hints what is the cause of the error. We might see “Error in `+.gg` at least in a couple scenarios while making a plot using ggplot2 in R.
Let us load packages we will be using
library(tidyverse)
library(palmerpenguins)
theme_set(theme_bw(16))
We will see two scenarios where we will see this error message and learn how to fix them.
ggplot2 error: Cannot use `+.gg()` : First example
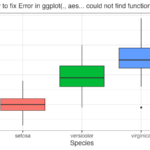
Let us say we are trying to make a boxplot with jittered data points. Our goal is to make a plot like this.

And we write the following R code to make the plot using ggplot2.
# R code with a mistake that gives "Error in `+.gg`:"
penguins %>%
  ggplot(aes(x=species, y=body_mass_g, color=species))
  + geom_boxplot(outlier.shape = NA) +
  geom_jitter(width=0.2)+
  theme(legend.position = "none")
Using the code above we will get the following error instead of the plot that we aimed to make
Error in `+.gg`:
! Cannot use `+.gg()` with a single argument. Did you accidentally put + on a new line?
Backtrace:
 1. ggplot2:::`+.gg`(geom_boxplot(outlier.shape = NA))
 Error in `+.gg`(geom_boxplot(outlier.shape = NA)) :
The error message here is but helpful. First it asks “Did you accidentally put + on a new line?” . We can immediately check for “+” on a new line and we find that there is “+” sign before geom_boxplot() in our code. If we see the error message again we can see that the Backtrace actually started at out geom_boxplot() statement.
Now that we have identified the problem we can remove th “+” sign at the beginning of line and put that at the end of previous line where we have ggplot() statement.
ggplot2 error: Cannot use `+.gg()` : Second example
Here is an example of another reason to see the same error. Let us say we are trying to be the boxplot with jittered datapoints as before and this time we write the following R code. We can quickly see that we don’t any “+” sign at the new line.
penguins %>
  ggplot(aes(x=species, y=body_mass_g, color=species))+
  geom_boxplot(outlier.shape = NA)+
  geom_jitter(width=0.2)+ +
  theme(legend.position = "none")
Still we will get the following error message (the same as before).
Error in `+.gg`:
! Cannot use `+.gg()` with a single argument. Did you accidentally put + on a new line?
Backtrace:
 1. ggplot2:::`+.gg`(theme(legend.position = "none"))
 Error in `+.gg`(theme(legend.position = "none")) :
We can see that the error message is possibly before our theme(legend.position=”none”) statement. If we check the code in the previous line we find that at the end of the previous line we have two “+” signs. And that thas triggered the same error. By emoving that two “+” signs we get the boxplot we wanted.
penguins %>
  ggplot(aes(x=species, y=body_mass_g, color=species))+
  geom_boxplot(outlier.shape = NA)+
  geom_jitter(width=0.2)+
  theme(legend.position = "none")