Last updated on August 17, 2022
In this post we will see an example of one of most common errors while making a plot with ggplot2 and how to fix them.
library(tidyverse)
theme_set(theme_bw(16)
Let us we are trying to make a scatter plot using ggplot2 using the following code. Here we use mtcars dataset built-in R to make the scatter plot
mtcars %>%
  ggplot(mpg,disp)+
  geom_point()
If we try to execute the code we will get the following error.
Error in `ggplot()`:
! Mapping should be created with `aes()` or `aes_()`.
How to fix: ggplot2 error: Mapping should be created with `aes() or aes_()`
The error here is definitely is useful in coming up with ways to fix the error. The error message indirectly saying the we are missing aes() while specifying x and y-axis variables for the scatter plot.
By correctly adding aes() as shown below
mtcars %>%
ggplot(aes(mpg,disp))+
geom_point()+
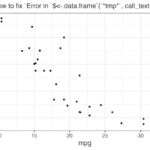
labs(subtitle= "How to fix: ggplot2 error: Mapping should be created with `aes()`")
ggsave("how_to_fix_ggplot2_error_Mapping_should_be_created_with_aes.png")
We will get the intended scatter plot shown below.

Explore the Complete ggplot2 Guide
35+ tutorials with code: scatterplots, boxplots, themes, annotations, facets, and more—tested and beginner-friendly.
Visit the ggplot2 Hub → No fluff—just code and visuals.