In this post, we will learn how to encircle data points with ggplot2. In R, there are multiple ways to highlight/annotate data points. Here we will use, ggalt, one of the ggplot2 extension packages to encircle data points. ggalt‘s geom_encircle() function can automagically encircle points belonging to multiple groups.
Setting data and packages
First, let us load the packages needed. We can install ggalt from CRAN and we have ggalt version ‘0.4.0’. Let us also load palmer penguins dataset for making scatter plots and highlighting or encircling points on the plot.
library(tidyverse)
library(palmerpenguins)
library(ggalt)
theme_set(theme_bw(16))
packageVersion("ggalt")
# 0.4.0
Let us make a simple scatter plot
penguins %>%
  ggplot(aes(x = flipper_length_mm,
             y = body_mass_g,
             color = species))+
  geom_point()
Circling data points with geom_encircle()
We can use geom_encircle() as additional layer to our existing ggplot to automagically detect and encircle data points.
penguins %>%
  ggplot(aes(x =flipper_length_mm,
             y = body_mass_g,
             color = species))+
  geom_point()+
  geom_encircle(s_shape = 1, expand=0)
In this example, geom_encircle() has encircled three groups, i.e. species, and circled around each group’s the data points. If we had not added color by species in our scatter plot, ggalt’s geom_encircle() would encircle all the data points in the plot.

Circling Select Data points with geom_encircle()
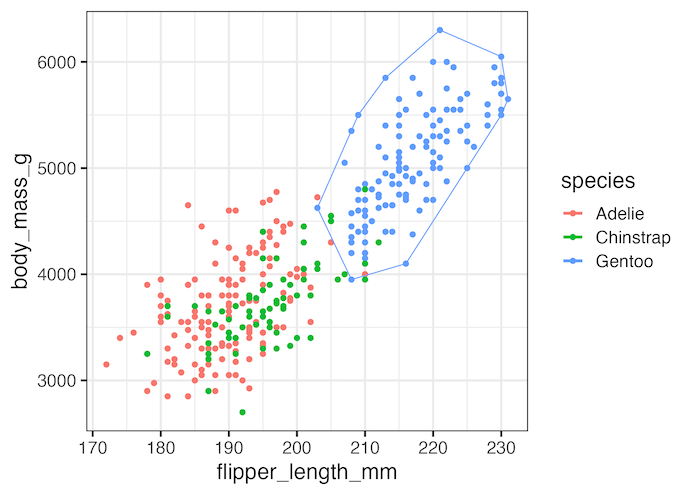
We can also select certain data points to encircle. In this example, we are encircling data points corresponding to Gentoo penguins. To do that we use data argument within geom_encircle(), like any other geoms in ggplot and provide the subset of data that we want to. use to encircle data points.
penguins %>%
  ggplot(aes(x=flipper_length_mm,
             y = body_mass_g,
             color=species))+
  geom_point()+
  geom_encircle(data = filter(penguins,
                              species==  "Gentoo"),
                s_shape=1, expand=0)
ggsave("encircle_select_points_ggalt_geom_encircle.png")
geom_encircle() has encircled the selected data points, i.e. Gentoo species.
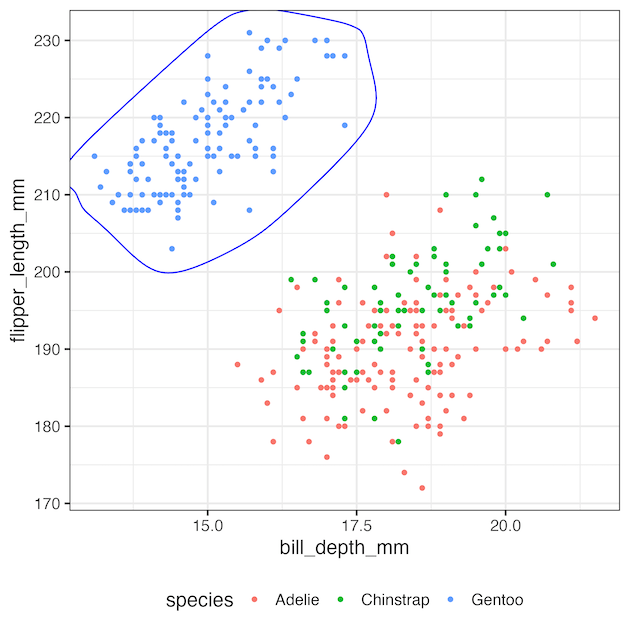
Here is another example of highlighting a select group using geom_encircle() function in ggalt.
penguins |>
  ggplot (aes(x = bill_depth_mm, y = flipper_length_mm, color = species)) +
  geom_point() +
  geom_encircle(data = penguins |> filter(species=="Gentoo"),
                aes(x = bill_depth_mm, y = flipper_length_mm),
                color = "blue", size = 1.5)