Last updated on August 22, 2025
ECDF plot, aka, Empirical Cumulative Density Function plot is one of the ways to visualize one or more distributions.
In this post, we will learn how to make ECDF plot using Seaborn in Python. Till recently, we have to make ECDF plot from scratch and there was no out of the box function to make ECDF plot easily in Seaborn. With the Seaborn version 0.11.0 that became available we have function ecdfplot to make ECDF plot.
The ECDF plot has two key advantages. Unlike the histogram or KDE, it directly represents each datapoint. That means there is no bin size or smoothing parameter to consider. Additionally, because the curve is monotonically increasing, it is well-suited for comparing multiple distributions:
With the new Seaborn version we have two functions available to make ECDF plot. We will first use ecdfplot() function in Seaborn to ECDF plot and then also use Seaborn’s displot() function to ECDF plot.
👉 Want more? Explore the full Seaborn Tutorial Hub with 35+ examples, code recipes, and best practices.
Let us load the libraries needed for making ECDF plot.
import matplotlib.pyplot as plt
import seaborn as sns
import pandas as pd
sns.set_context("talk")
print(sns.__version__)
0.11.0
penguins = sns.load_dataset("penguins")
penguins.head()
species	island	bill_length_mm	bill_depth_mm	flipper_length_mm	body_mass_g	sex
0	Adelie	Torgersen	39.1	18.7	181.0	3750.0	Male
1	Adelie	Torgersen	39.5	17.4	186.0	3800.0	Female
2	Adelie	Torgersen 	40.3	18.0	195.0	3250.0	Female
3	Adelie	Torgersen	NaN	NaN	NaN	NaN	NaN
4	Adelie	Torgersen	36.7	19.3	193.0	3450.0	Female
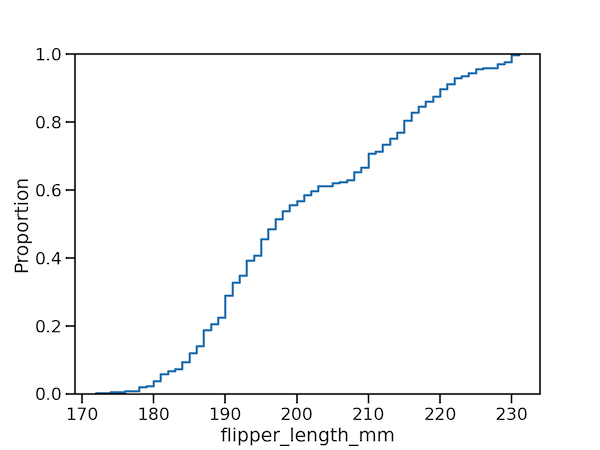
Simple ECDF plot with Seaborn ecdfplot()
plt.figure(figsize=(8,6))
sns.ecdfplot(penguins,
             x="flipper_length_mm")
plt.savefig("simple_ecdf_plot_with_ecdfplot_Seaborn.png",
                    format='png',dpi=150)
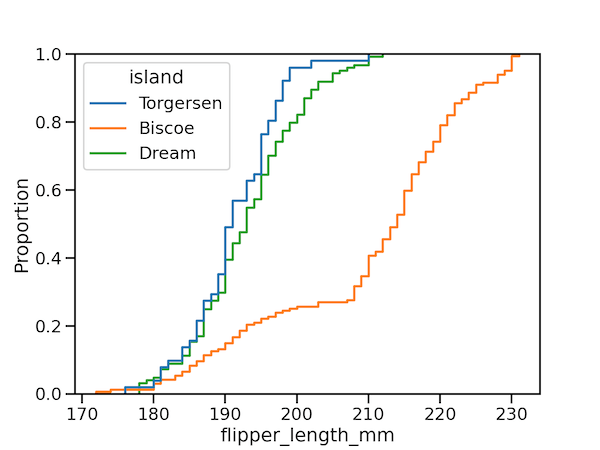
ECDF plot of multiple distributions
plt.figure(figsize=(8,6))
sns.ecdfplot(penguins,
             x="flipper_length_mm",
             hue="island")
plt.savefig("Seaborn_ecdf_plot_with_ecdfplot.png",
                    format='png',dpi=150)
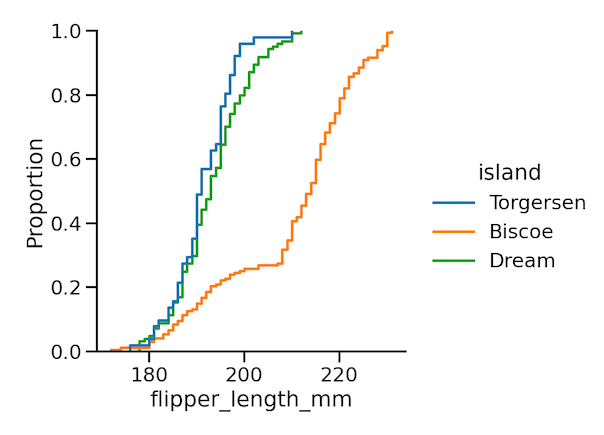
ECDF plot with Seaborn displot() function
plt.figure(figsize=(10,8))
sns.displot(penguins,
            x="flipper_length_mm",
            hue="island",
            kind="ecdf")
plt.savefig("Seaborn_ecdf_plot_with_displot.png",
                    format='png',dpi=150)
Seaborn version 0.11.0 is filled with tonnes of new features and check out a couple of blog posts to learn about what is new and the new Seaborn functions to make better Data Visualization.