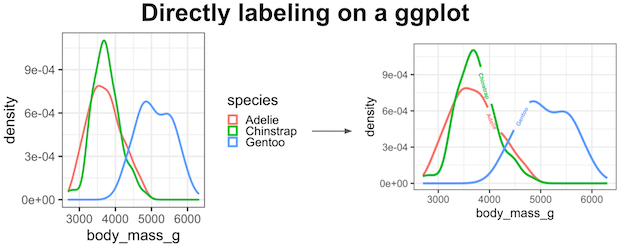
Labeling a plot greatly help understand the gist of a plot easily. ggplot2 offers a number of ways to add text labels to a plot. Often directly adding the labels on a plot instead of having a legend is a better option.
The R package, geomtextpath, a ggplot2 extension package offers a nice solution and it enables
Direct and automatic text labels that adhere to their associated line can also provide a neat alternative to legends, without the need for specifying exact label positions, and with a lower risk of overplotting.
Installing and loading packages
# install.packages("remotes")
remotes::install_github("AllanCameron/geomtextpath")
library(geomtextpath)
library(tidyverse)
theme_set(theme_bw(16))
Line plot with text label
with geom_textline() function in geomtextpath package, we can directly label on a line plot by specifying the label we want.
pressure %>%
  ggplot(aes(temperature, pressure)) +
  geom_textline(label = "Mercury vapor pressure",
                color = "deepskyblue4",
                linewidth=2)
ggsave("directly_labeling_on_line_with_geomtextpath_ggplot.png")
geomtextpath nicely adds the label on the line plot.

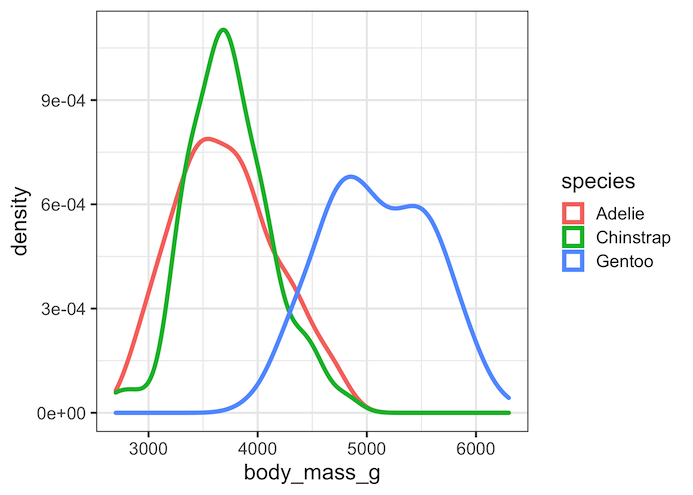
Density plot with legends on the side
Typically, we highlight a third variable on a line plot or density plot using color with legends. ggplot2 easily enables with color argument.
Here is a simple example using Palmer penguin datasets, where the density lines are colored by species variable with color legends on the side of the plot.
library(palmerpenguins)
  drop_na() %>%
  ggplot(aes(x = body_mass_g, colour = species)) +
  geom_density(size=1.5)
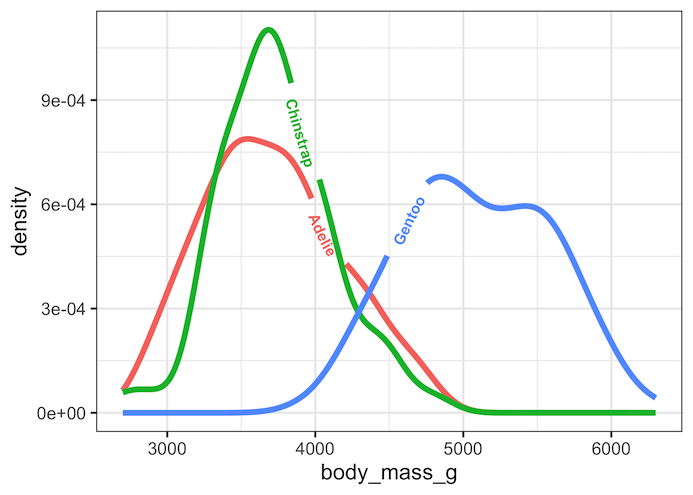
Density plot with direct labels on density lines with geom_textpath()
One of the biggest challenges with having color legend on the side is depending on the number of variables we plot and how they behave on the plot, it can get difficult to identify which line correspond to which variable.
With geom_textdensity() function in geomtextpath package, we can directly add labels, curvy text replacing a portion of lines on the plot.
penguins %>%
  drop_na() %>%
  ggplot(aes(x = body_mass_g, colour = species, label = species)) +
  geom_textdensity(fontface = 2,
                   linewidth=2,
                   hjust = 0.5,
                   vjust = 0.9)+
  theme(legend.position = "none")
Such direct labelling can make some plots really easy to read and understand.
Explore the Complete ggplot2 Guide
35+ tutorials with code: scatterplots, boxplots, themes, annotations, facets, and more—tested and beginner-friendly.
Visit the ggplot2 Hub → No fluff—just code and visuals.


