
In this post, we will learn of two ways to deal with outlier data points while making a boxplot. By default, ggplot2 boxplot() identifies the outliers and disply them as black dots at the boxplot extremes. One of the options to deal with outlier is to ignore them. With ggplot2, there are two ways to ignore the outliers in boxplot. We will learn how to ignore the outliers in boxplot and the subtle difference between the two approaches of ignoring outliers.
Let us first load the packages needed.
library(tidyverse)
library(gapminder)
theme_set(theme_bw(16))
packageVersion("ggplot2")

[1] '3.5.1'
We will be using gapminder data to make boxplot between life expectancy and continents.
gapminder |> head()

# A tibble: 6 × 6
  country     continent  year lifeExp      pop gdpPercap
  <fct>       <fct>     <int>   <dbl>    <int>     <dbl>
1 Afghanistan Asia       1952    28.8  8425333      779.
2 Afghanistan Asia       1957    30.3  9240934      821.
3 Afghanistan Asia       1962    32.0 10267083      853.
4 Afghanistan Asia       1967    34.0 11537966      836.
5 Afghanistan Asia       1972    36.1 13079460      740.
6 Afghanistan Asia       1977    38.4 14880372      786.
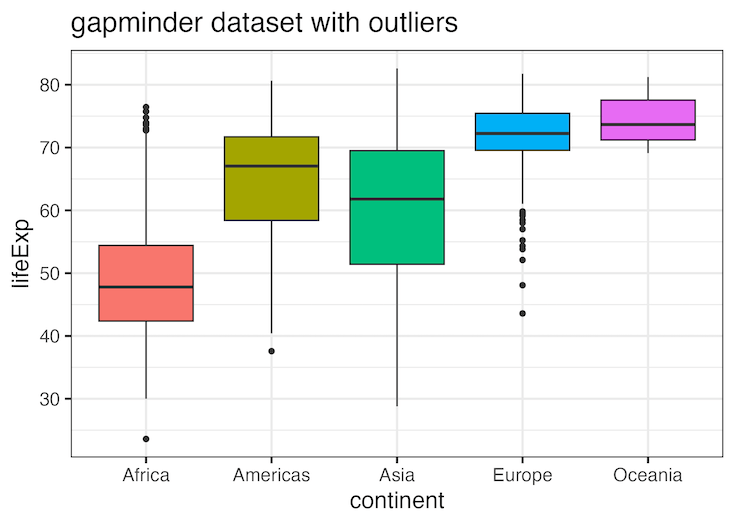
We can see that, by default, ggplot2 displays the outlier data points as dots at the extremes of the boxes.
gapminder |>
  ggplot(aes(x=continent, y=lifeExp, fill=continent))+
  geom_boxplot()+
  labs(title="gapminder dataset with outliers")+
  theme(legend.position="none")+
  scale_y_continuous(breaks=scales::breaks_pretty(n=8))
ggsave("boxplot_outliers_ggplot2.png")
In the example below, both the continents Africa and Europe have a few outliers at the top and bottom of the boxes in the boxplot.
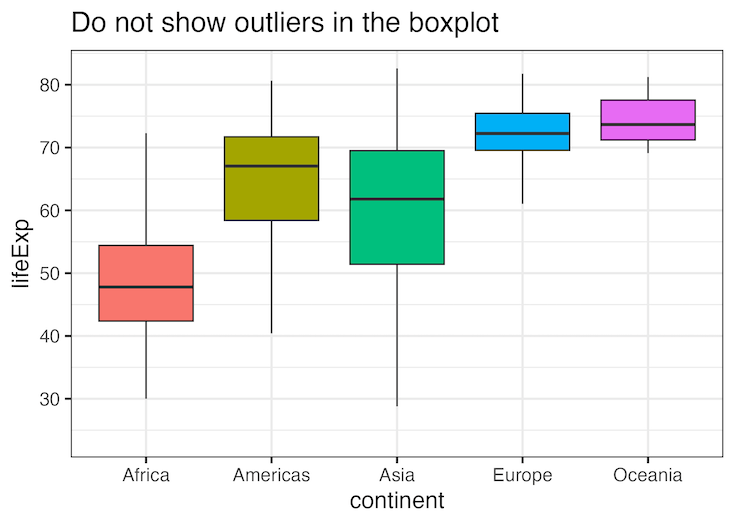
outlier.shape=NA: Ignore outliers in boxplot by not displaying them
We can use outlier.shape=NA as an argument to geom_boxplot() to ignore while displaying the boxplot. Under the hood, geom_boxplot() uses all the data to compute the summary statistics to make the boxplot.
gapminder |>
  ggplot(aes(x=continent, y=lifeExp, fill=continent))+
  geom_boxplot(outlier.shape=NA)+
  labs(title="Do not show outliers in the boxplot")+
  theme(legend.position="none")+
  scale_y_continuous(breaks=scales::breaks_pretty(n=8))
ggsave("do_not_show_outliers_in_boxplot_ggplot2.png")
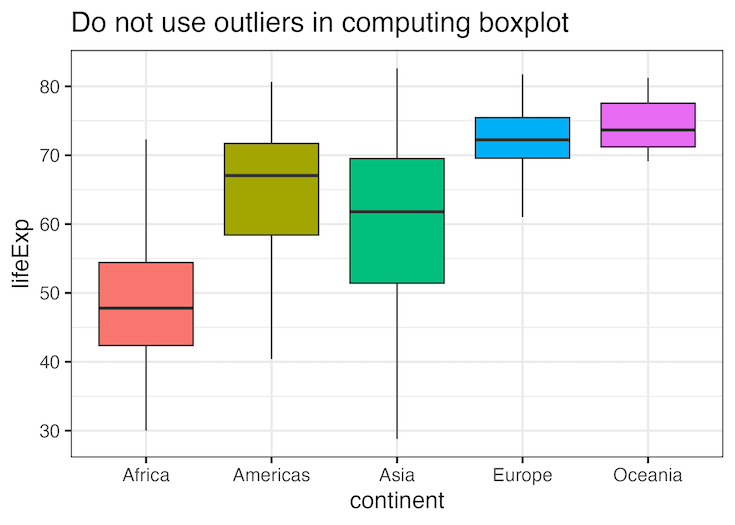
outliers=FALSE: to not take them into account while making boxplot
With outliers=FALSE as an argument to geom_boxplot() to we can ignore the outliers while computing the summary statistics to make the boxplot. outliers=FALSE argument is available from ggplot2 version 3.5.0 and the big difference by “discarding outliers, the axis limits will adapt to the box and whiskers only, not the full data range”.
gapminder |>
  ggplot(aes(x=continent, y=lifeExp, fill=continent))+
  geom_boxplot(outliers=FALSE)+
  labs(title="Do not use outliers in computing boxplot")+
  theme(legend.position="none")+
  scale_y_continuous(breaks=scales::breaks_pretty(n=8))
ggsave("do_not_use_outliers_in_boxplot_ggplot2.png")
Explore the Complete ggplot2 Guide
35+ tutorials with code: scatterplots, boxplots, themes, annotations, facets, and more—tested and beginner-friendly.
Visit the ggplot2 Hub → No fluff—just code and visuals.


